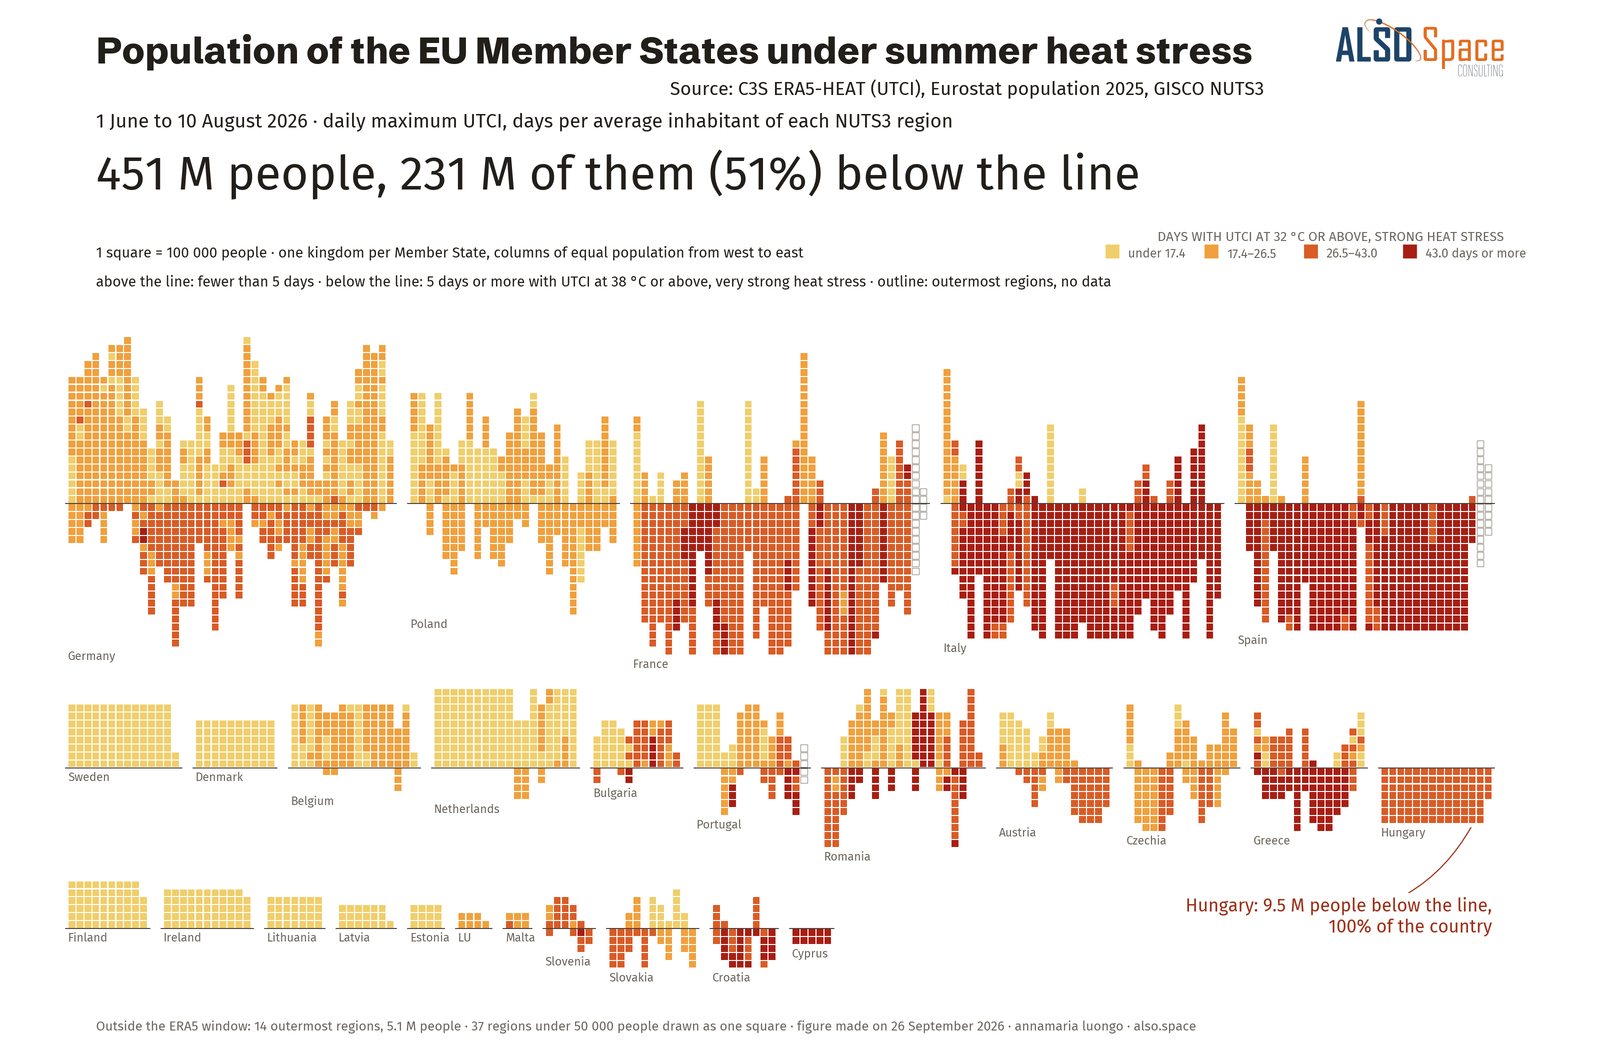
On 27 June, strong heat stress affected 85% of the people living in the European Union at the same time. The heaviest load stayed in the Mediterranean, while the most unusual summer was further north.
Temperatures describe places, while I wanted to count the people who live in them. For the summer of 2026, I combined the heat stress index of the Copernicus Climate Change Service (C3S) with the number of residents of every region of the European Union, published by Eurostat, and counted how many people lived where each condition held, day by day. The picture which emerges differs from the one given by temperature alone.
Strong heat stress, the level at which the Universal Thermal Climate Index (UTCI) reaches 32 °C, affected 95% of the people living in the EU at least once. For 207 million people, almost half of the population, it added up to a month or more. On 27 June, 383 million people were under strong heat stress at the same time, which is 85% of all residents.
Very strong heat stress or worse, with the index at 38 °C or above, affected 352 million people. For about a quarter of them, it added up to more than two weeks.
The heaviest load stayed in the south, where people in Cyprus, Italy, and Spain spent most of the summer under strong heat stress, although the most unusual part of the summer was further north. In June and July, days above 35 °C were more than ten times as frequent as normal for people in Belgium and France, compared with fewer than three times in Spain.
Nights followed the same pattern: the average number of tropical nights per person, in which the temperature stays at 20 °C or above, doubled, and the people with a month or more of them almost tripled, to 78 million. In other words, people across the European Union had a Mediterranean summer without being used to one.
In total, 262 million people lived in a place under a drought warning or alert for at least 10 days, and 175 million for a month or more. Counted in days per person, drought weighed almost as much as strong heat stress until the end of July.
For 122 million people, one in four, the two came together: more than two weeks of strong heat stress in June and July, in a place in drought for at least half of those two months. France had the largest number, 43 million, followed by Germany, Italy, and Hungary. The heat of Spain, by contrast, fell mostly on soils which were not dry.
Fire affected people mainly through proximity. By mid-August, 17 million people had a burnt area within 5 km of home, while the areas mapped by Copernicus rapid mapping reported about 13,000 residents, with 8 of the 27 activations giving no figure.
Along the coasts of Italy, Spain, France, Malta, Croatia, Greece, and Slovenia, 37 million residents lived for a month or more in front of a sea more than 2 °C warmer than normal. In addition, 146 million people, one in three, lived in a region whose main rivers were below half of their normal flow.
The day with the most people under strong heat stress and the peak of the sea and the fires fell weeks apart. On 22 July, when the Mediterranean peaked and the fires were at their worst, about 100 million people were under strong heat stress, roughly a quarter of the number at the late-June peak. The heat of late June affected the most people, while the heat of the second half of July coincided with the peak of the sea and the fires.
These figures count exposure and residents, so health outcomes, damage, and tourists are outside them. The heat stress thresholds are the same everywhere, although 32 °C is an ordinary summer day in much of the Mediterranean.
The UTCI of ERA5-HEAT, produced by C3S, combines temperature, humidity, wind, and radiation into a single measure of how the human body experiences heat. With it, the exposure of a whole continent can be counted in people, region by region and day by day.
Source: ERA5-HEAT and ERA5, Copernicus Climate Change Service; EDO, EFAS, EFFIS, and rapid mapping, Copernicus Emergency Management Service; Copernicus Marine Service; Eurostat population by region on 1 January 2025, spread within each region with the GHSL population grid of the Joint Research Centre. Exposure from 1 June to the latest date of each source, 10 August for heat. My calculation.