01 / 08
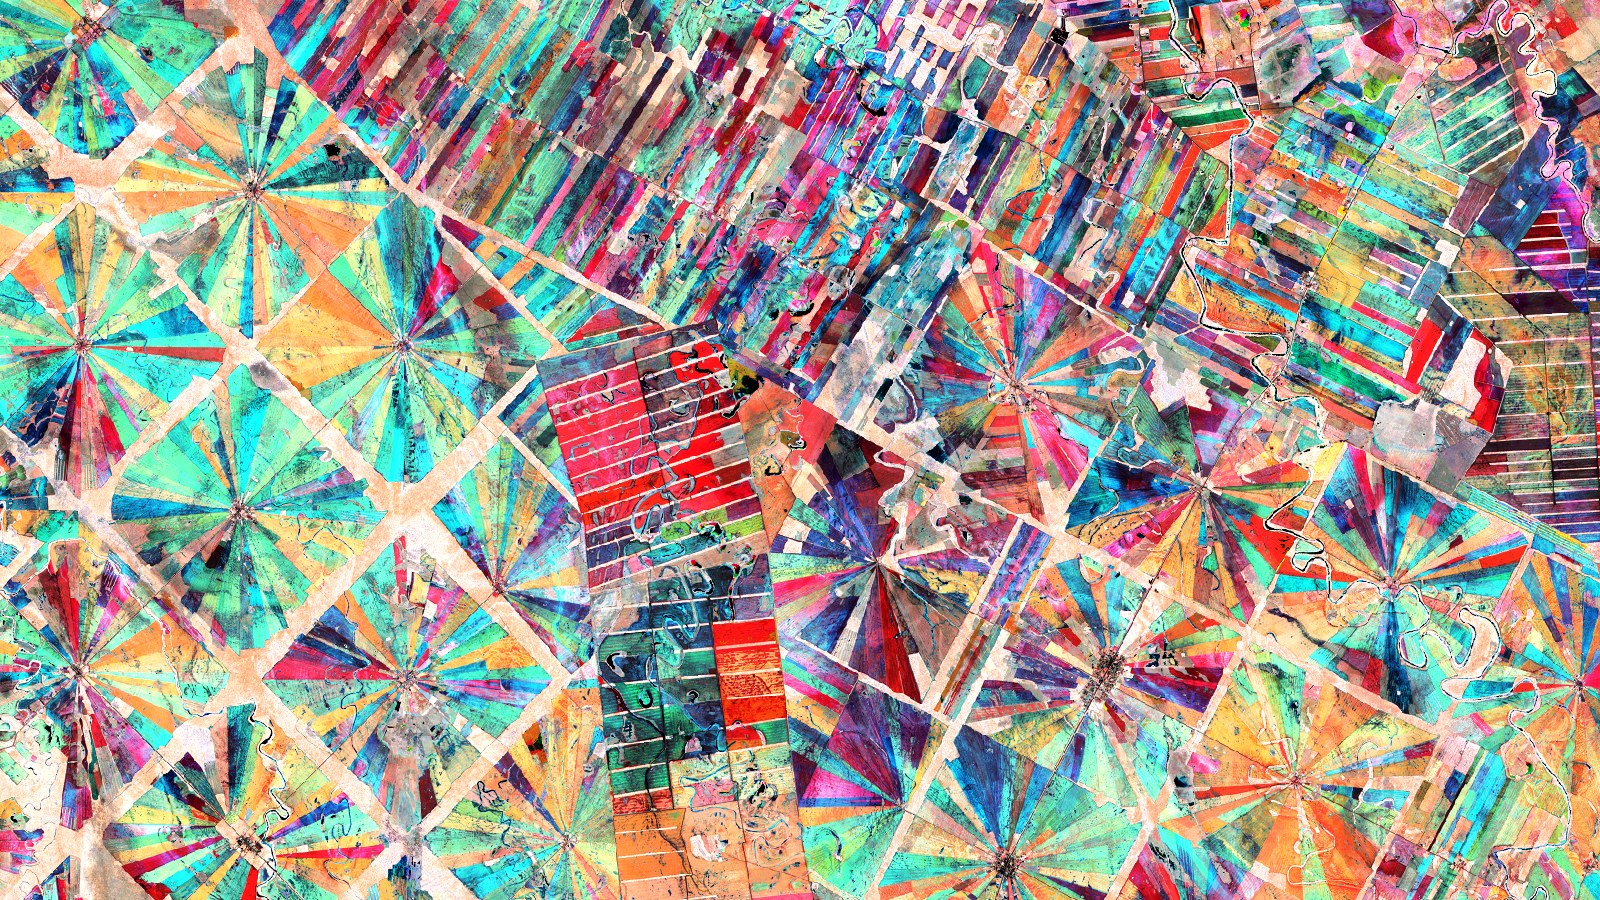
The radial fields of San Julián, BoliviaCrop growth stage, three months of NDVI, a community script · Sentinel-2 L1C, June to August 2017
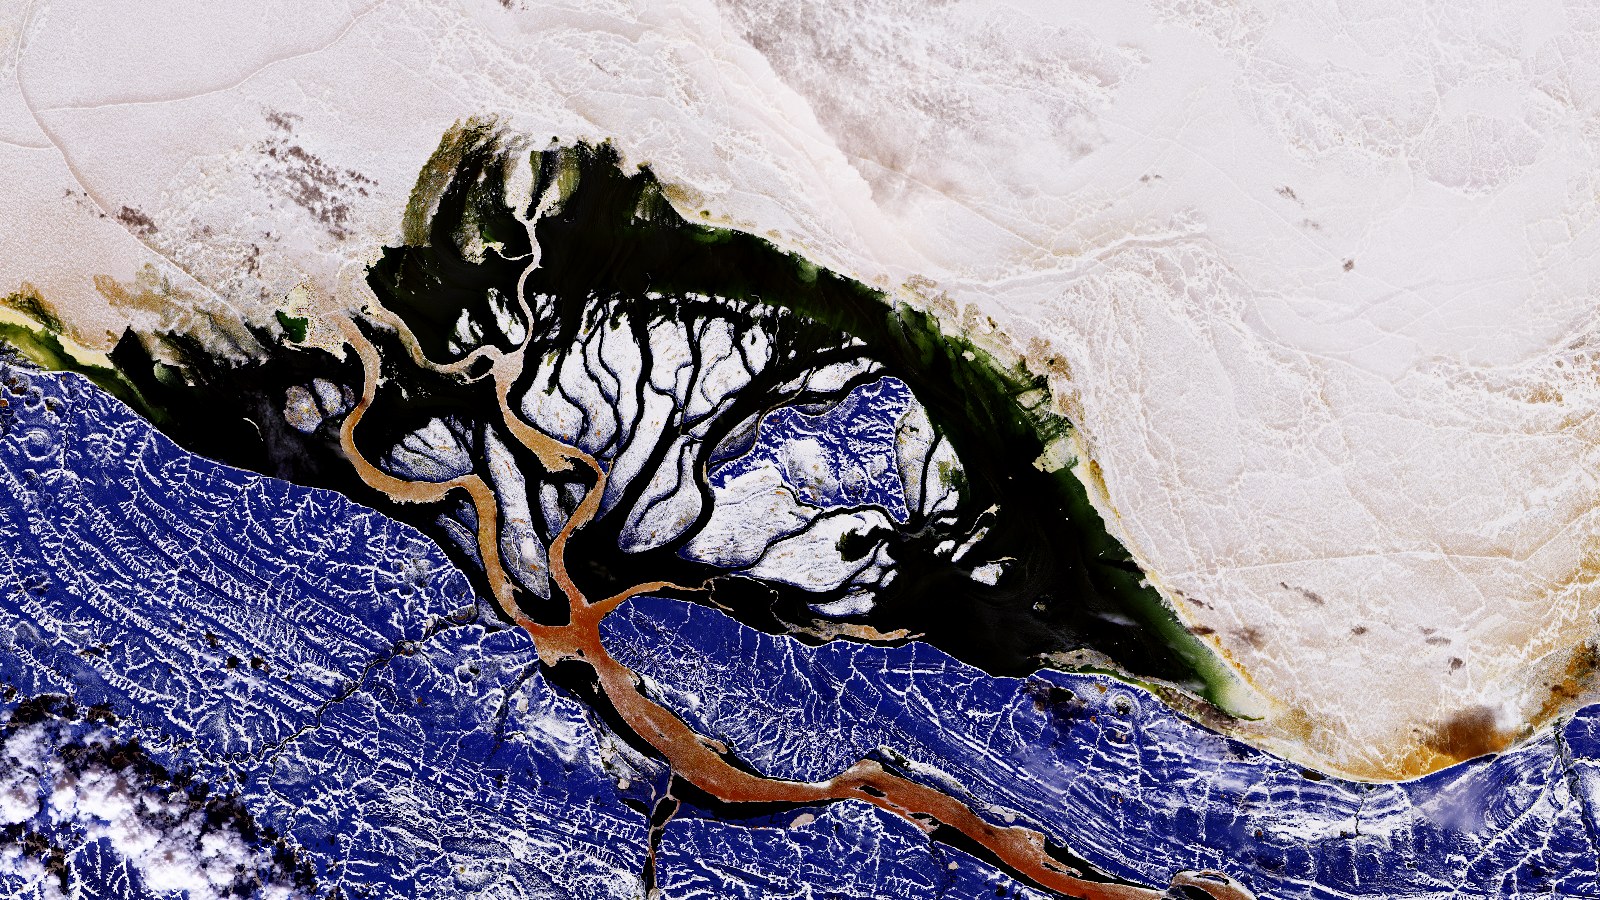
The Olenyok River meets the sea ice, SiberiaFalse colour, my recipe · Sentinel-2 L2A, 31 May 2020
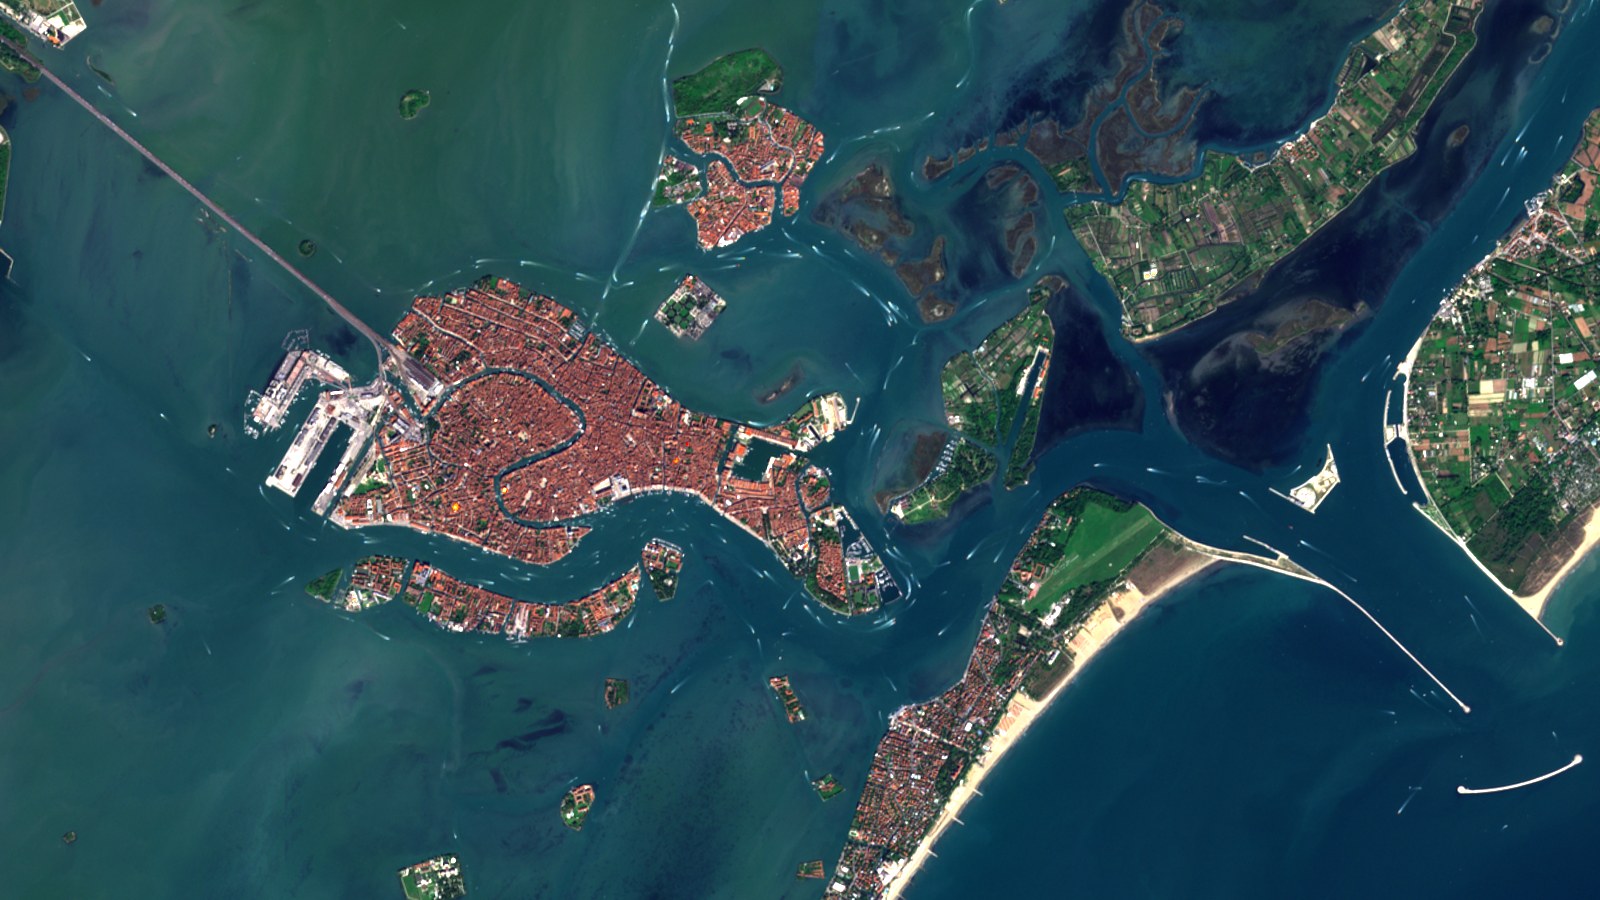
Venice and its lagoon, ItalyNatural colour, high contrast · Sentinel-2 L2A, 26 September 2026
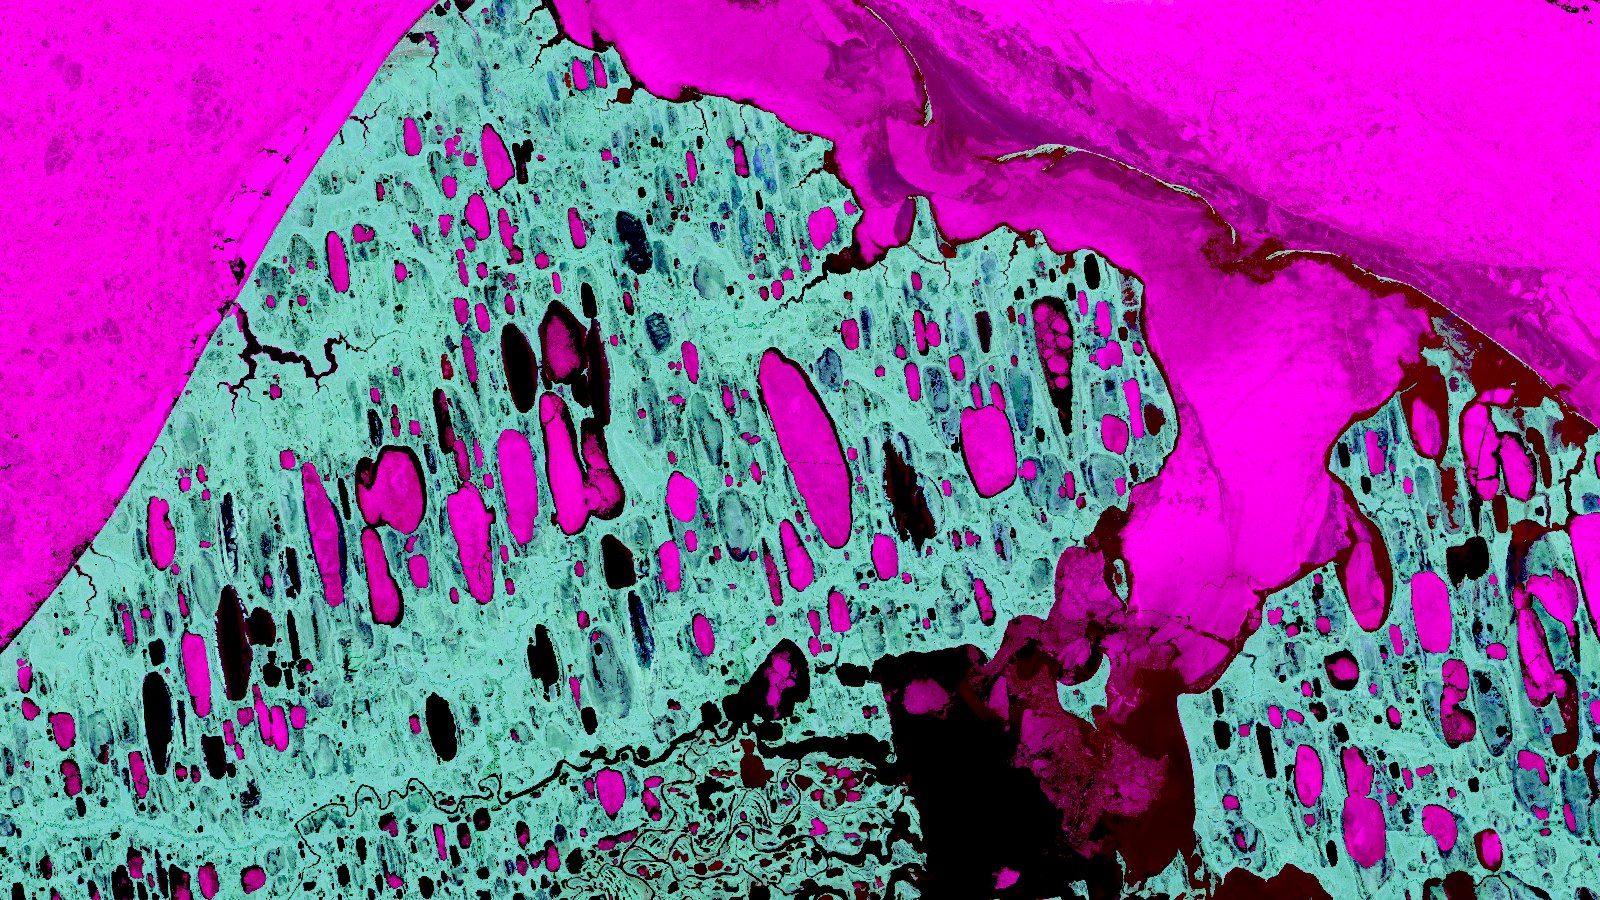
Thaw lakes and sea ice near Utqiagvik, AlaskaInfrared false colour, my recipe · Sentinel-2 L2A, 6 July 2026
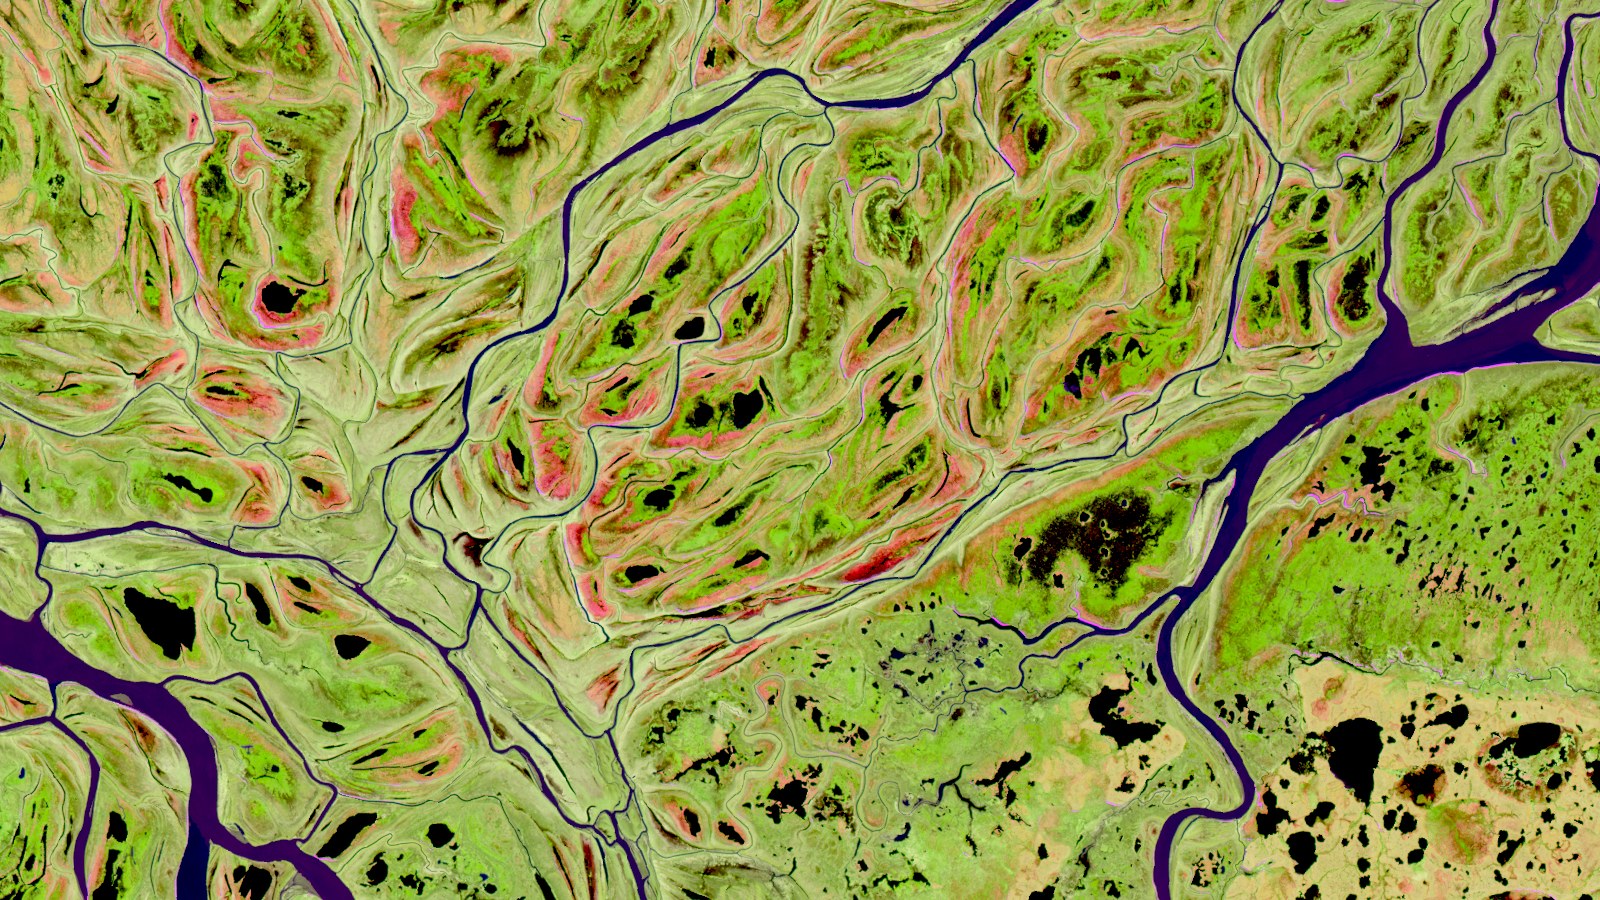
Channels and meander scars of the Yukon Delta, AlaskaInfrared false colour, my recipe · Sentinel-2 L2A, 26 May 2025
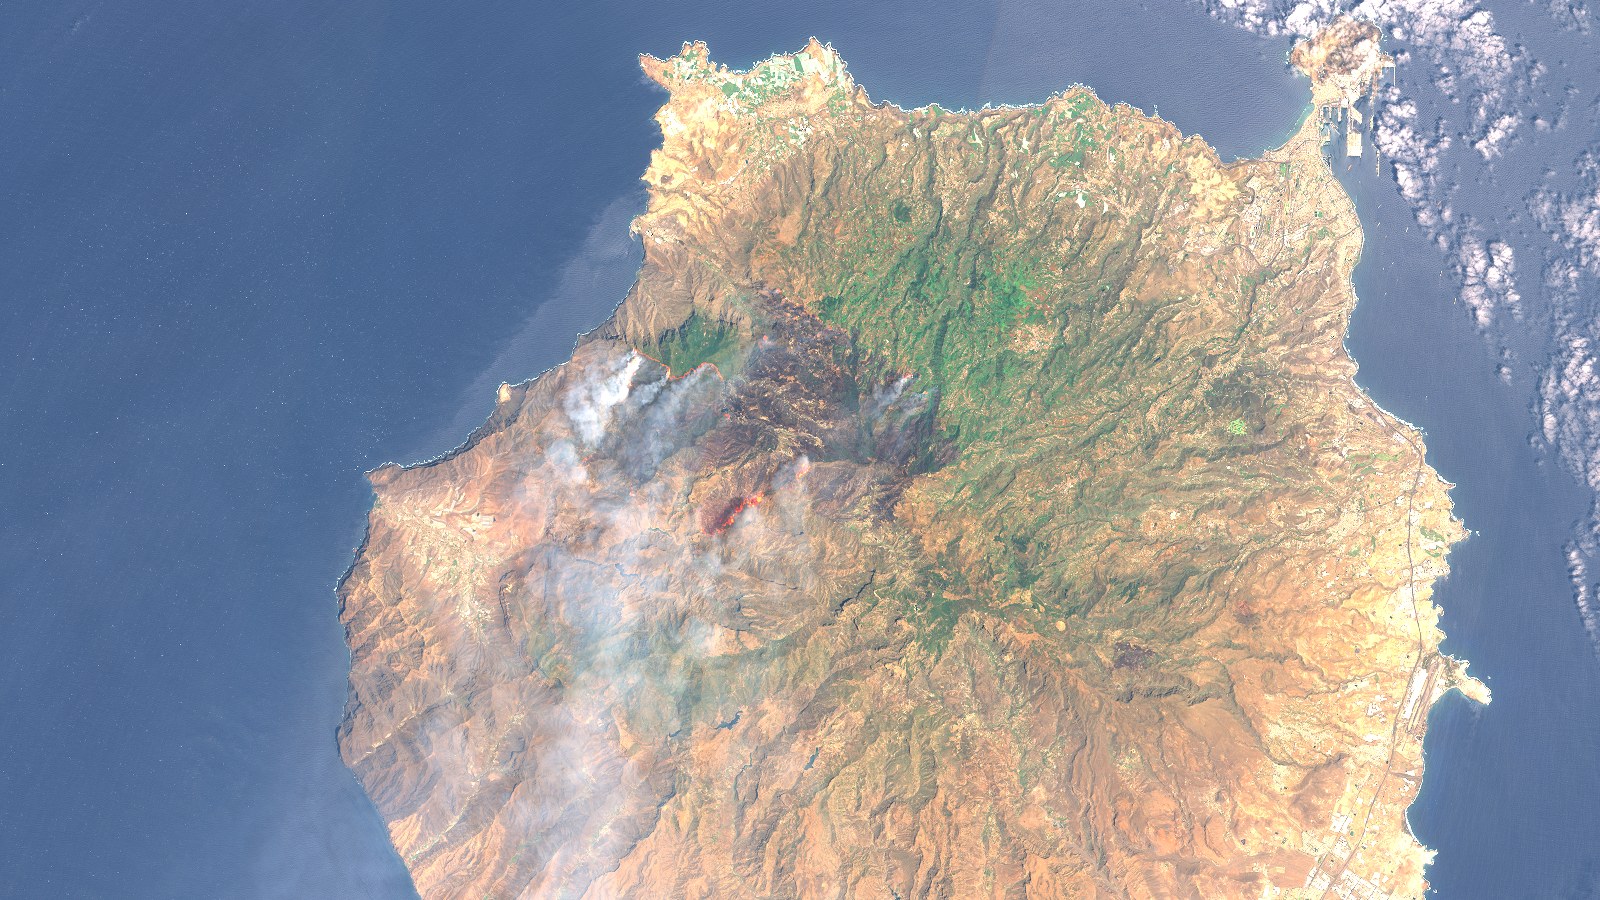
Smoke over Gran Canaria, Spain, during the wildfire of August 2019Natural colour with infrared bands · Sentinel-2 L1C, 19 August 2019
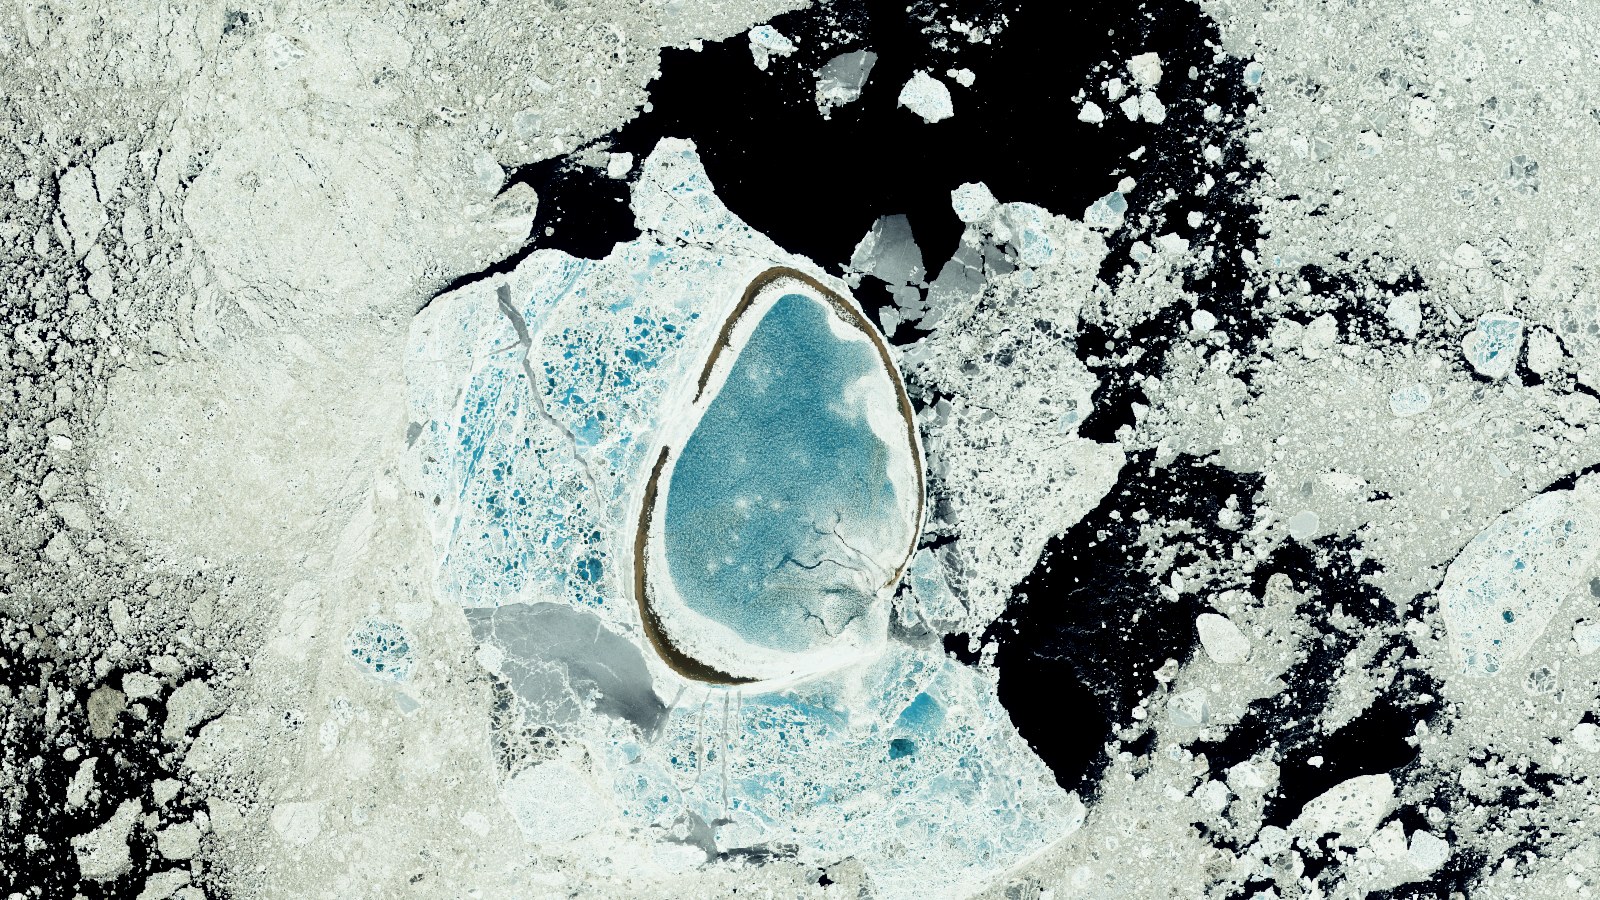
Peschany Island in the sea ice, Laptev Sea, SiberiaNatural colour with short-wave infrared, my recipe · Sentinel-2 L2A, 14 June 2020
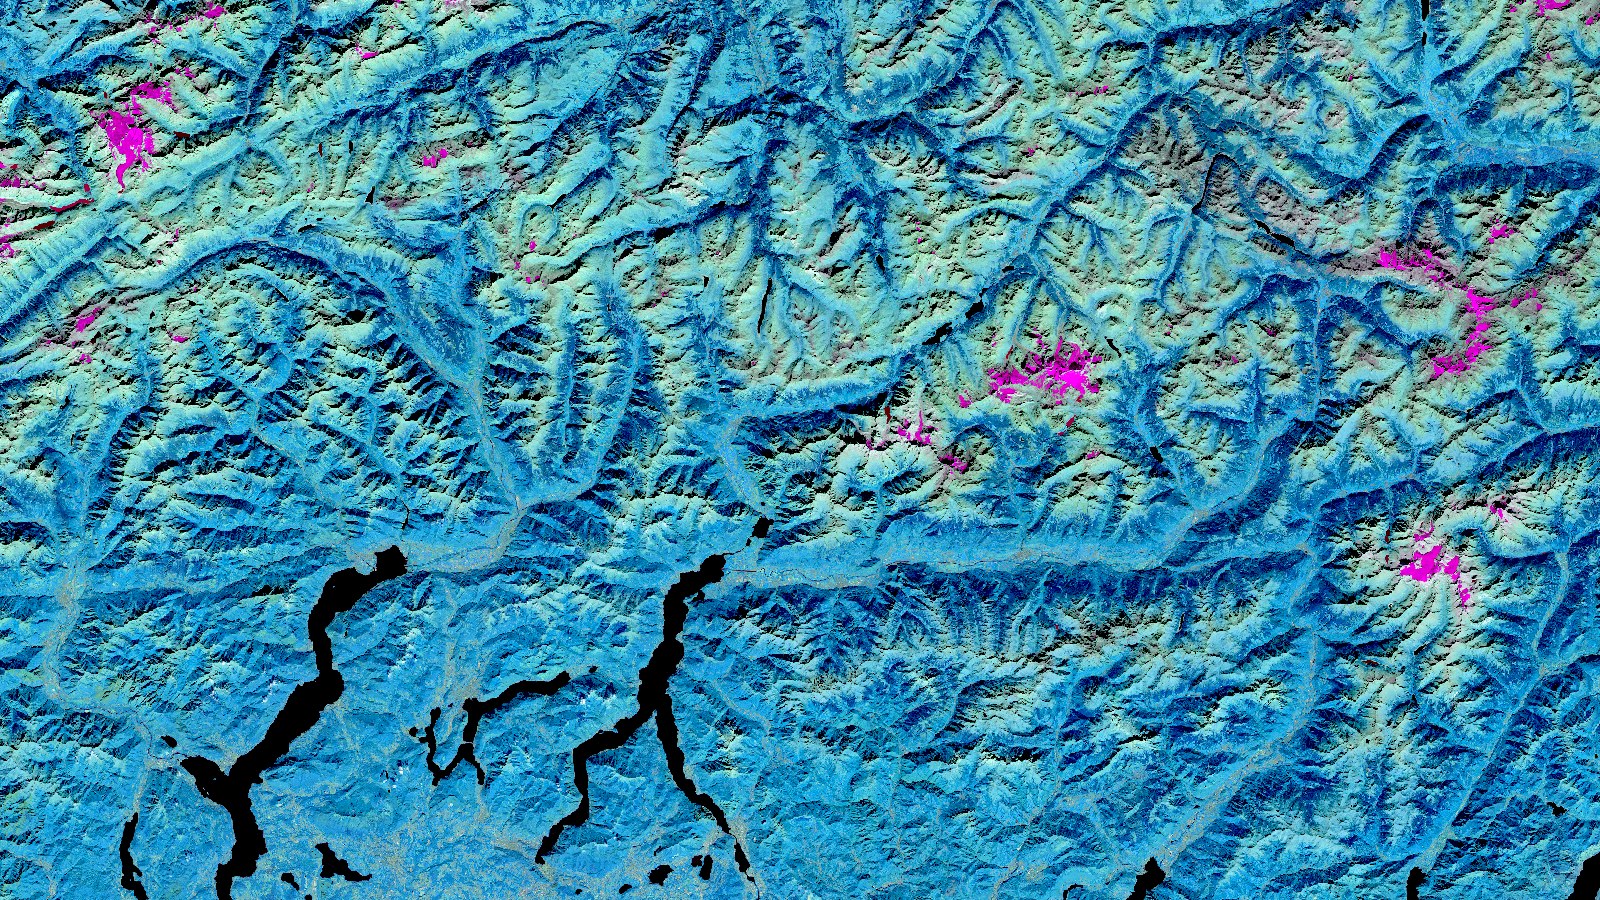
The central Alps above Lakes Maggiore, Lugano, and ComoInfrared false colour, my recipe · Sentinel-2 L1C, 27 September 2026