Annamaria Luongo

Earth Observation scientist · Brussels · Salerno

Annamaria Luongo

Helping people understand real-world facts through Earth Observation data.EO Dataviz · Data Artist and Storyteller · Managing Partner & Co-founder of ALSO Space

Move the cursor over the ice to see the same glacier on 6 September 2016 inside the circle. Adamello Glacier, Italy, 27 September 2026, Sentinel-2 in my short-wave infrared recipe, in which ice is cyan and meadows are green.

Scroll
Satellite images

Scenes I chose and drew.

All the images →
01 / 08
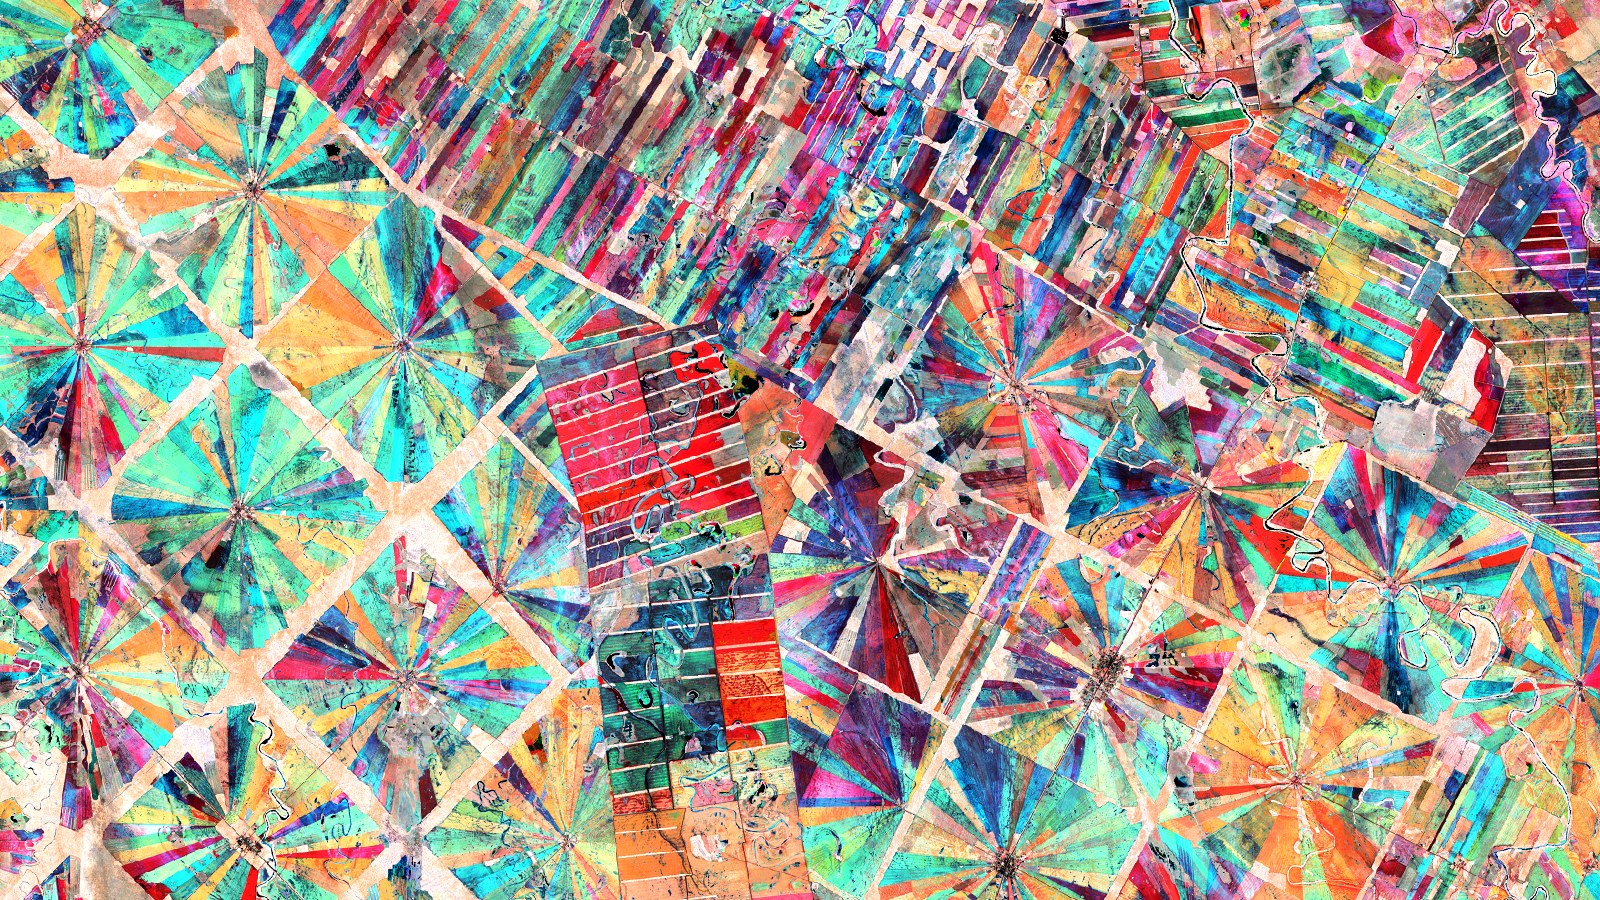
The radial fields of San Julián, Bolivia, Crop growth stage, three months of NDVI, a community script · Sentinel-2 L1C, June to August 2017
The radial fields of San Julián, BoliviaCrop growth stage, three months of NDVI, a community script · Sentinel-2 L1C, June to August 2017
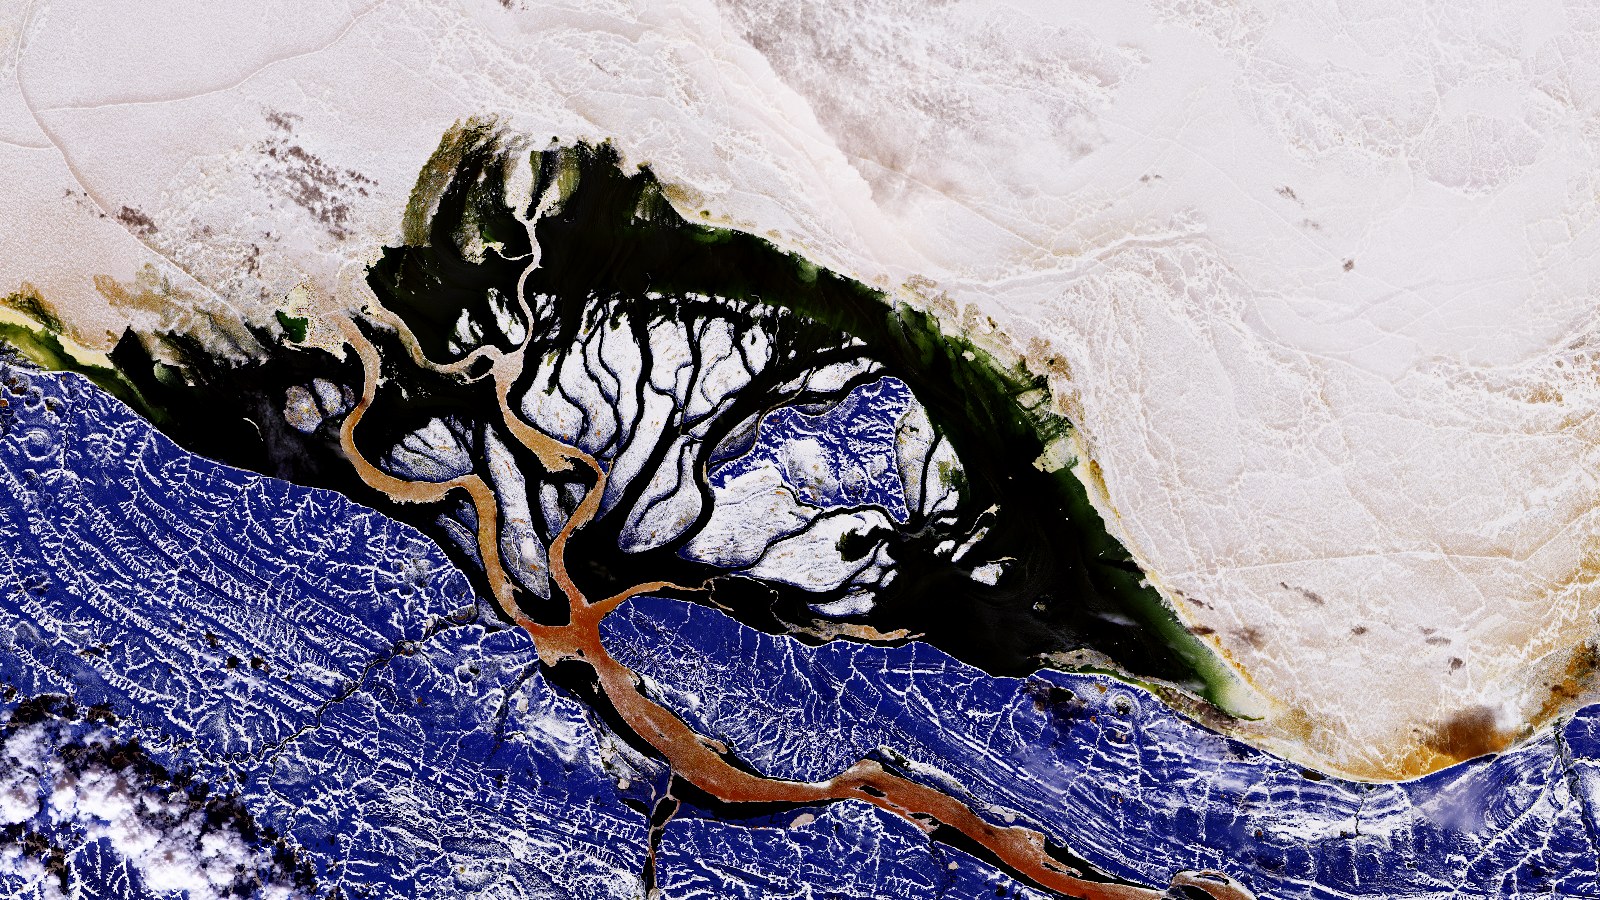
The Olenyok River meets the sea ice, Siberia, False colour, my recipe · Sentinel-2 L2A, 31 May 2020
The Olenyok River meets the sea ice, SiberiaFalse colour, my recipe · Sentinel-2 L2A, 31 May 2020
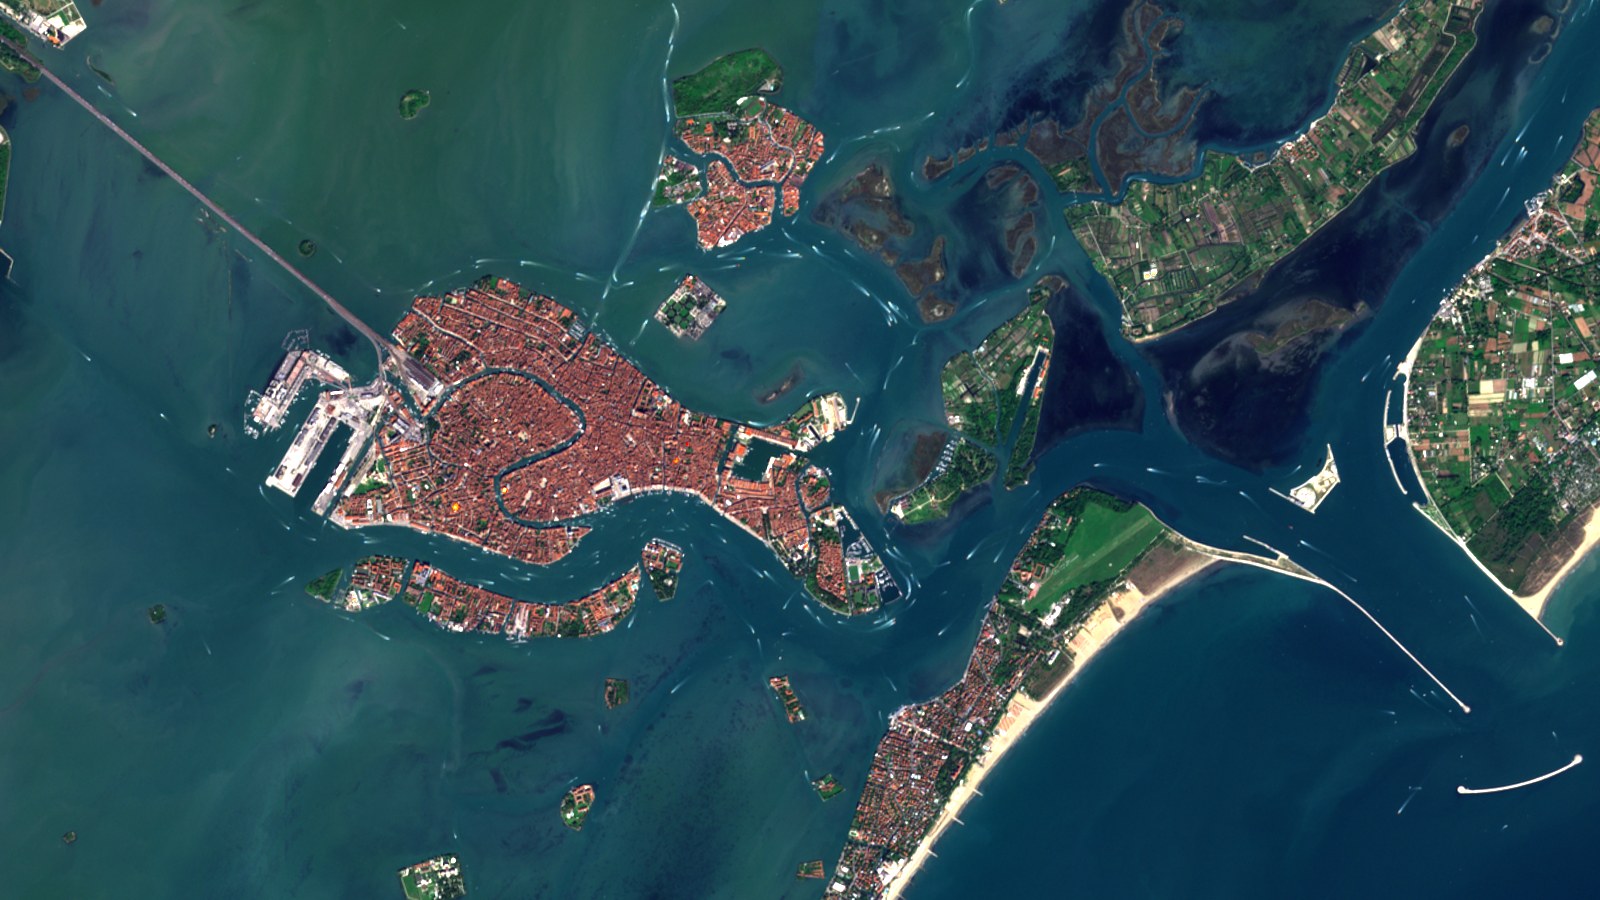
Venice and its lagoon, Italy, Natural colour, high contrast · Sentinel-2 L2A, 26 September 2026
Venice and its lagoon, ItalyNatural colour, high contrast · Sentinel-2 L2A, 26 September 2026
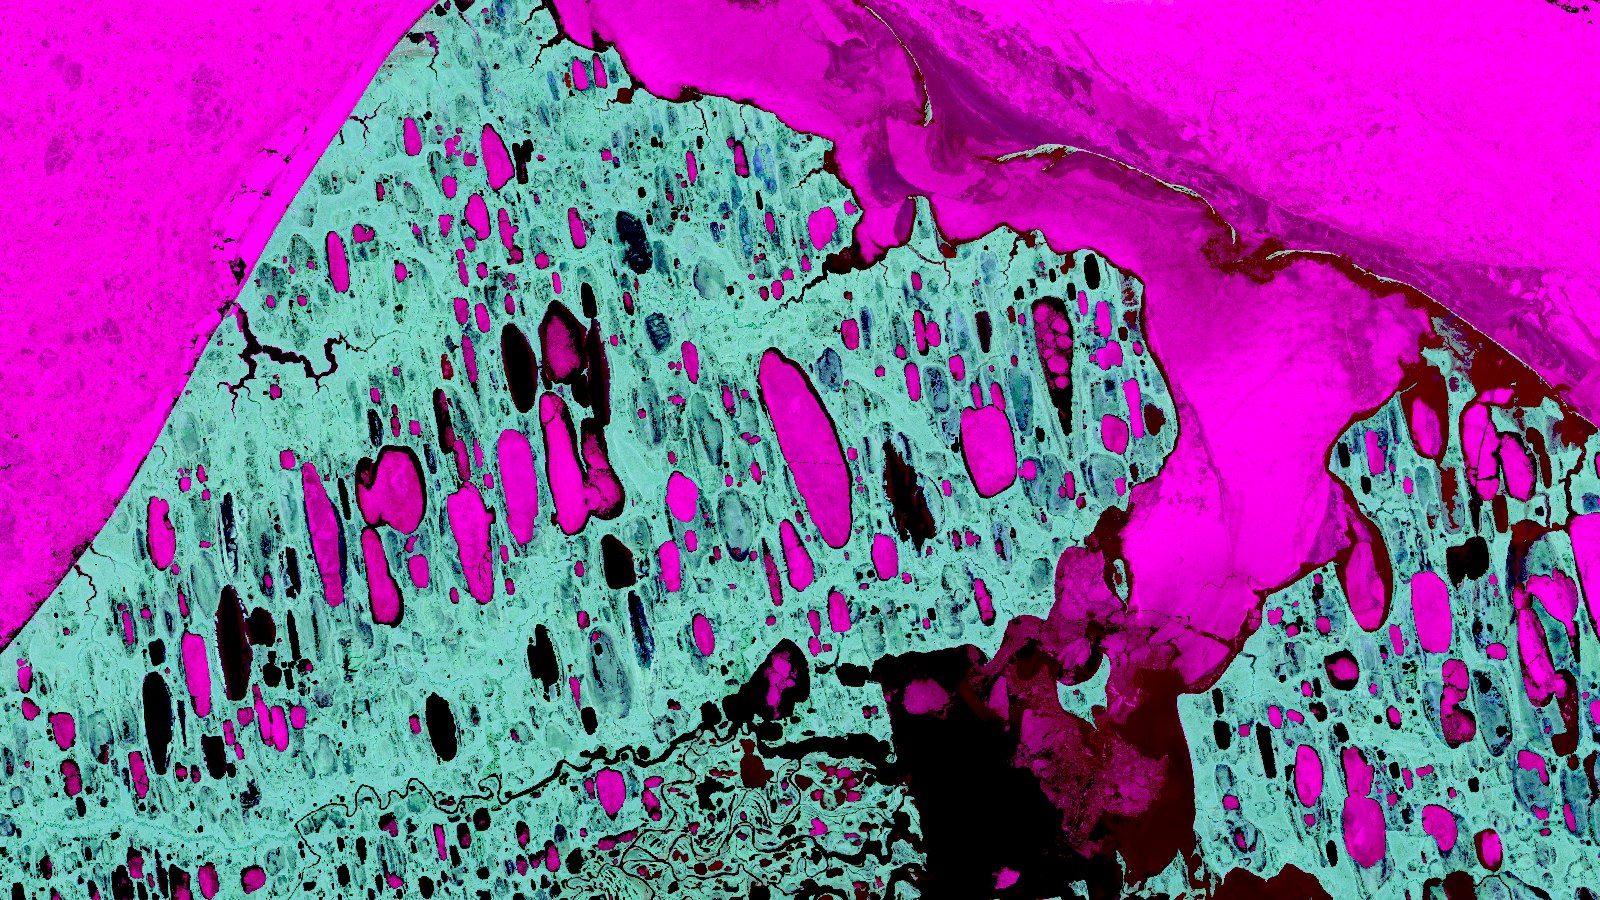
Thaw lakes and sea ice near Utqiagvik, Alaska, Infrared false colour, my recipe · Sentinel-2 L2A, 6 July 2026
Thaw lakes and sea ice near Utqiagvik, AlaskaInfrared false colour, my recipe · Sentinel-2 L2A, 6 July 2026
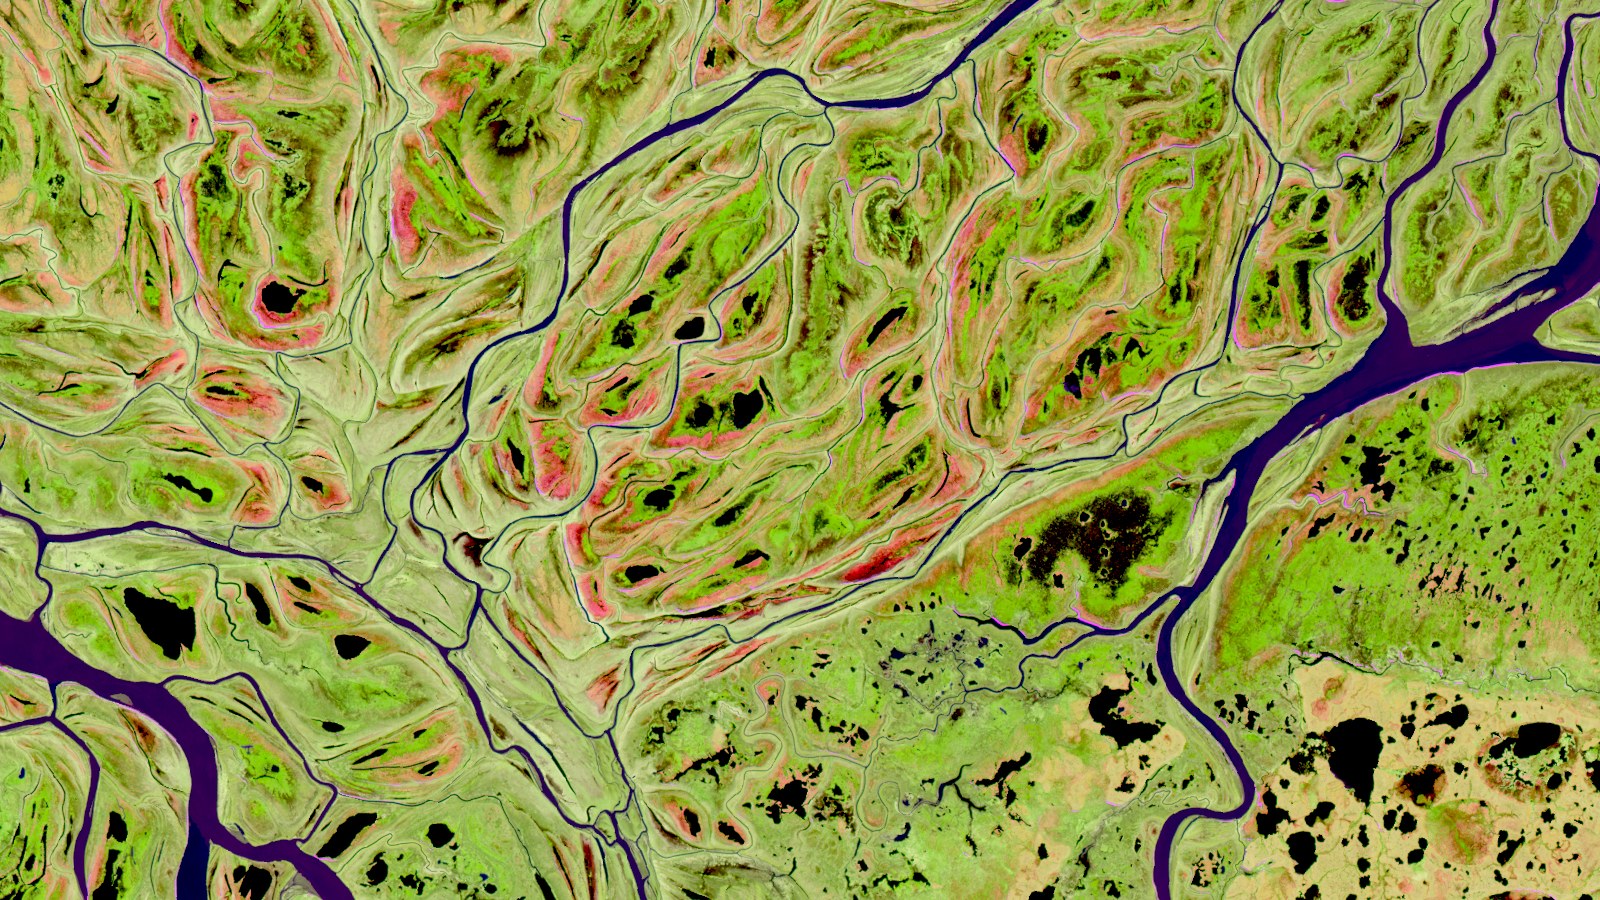
Channels and meander scars of the Yukon Delta, Alaska, Infrared false colour, my recipe · Sentinel-2 L2A, 26 May 2025
Channels and meander scars of the Yukon Delta, AlaskaInfrared false colour, my recipe · Sentinel-2 L2A, 26 May 2025
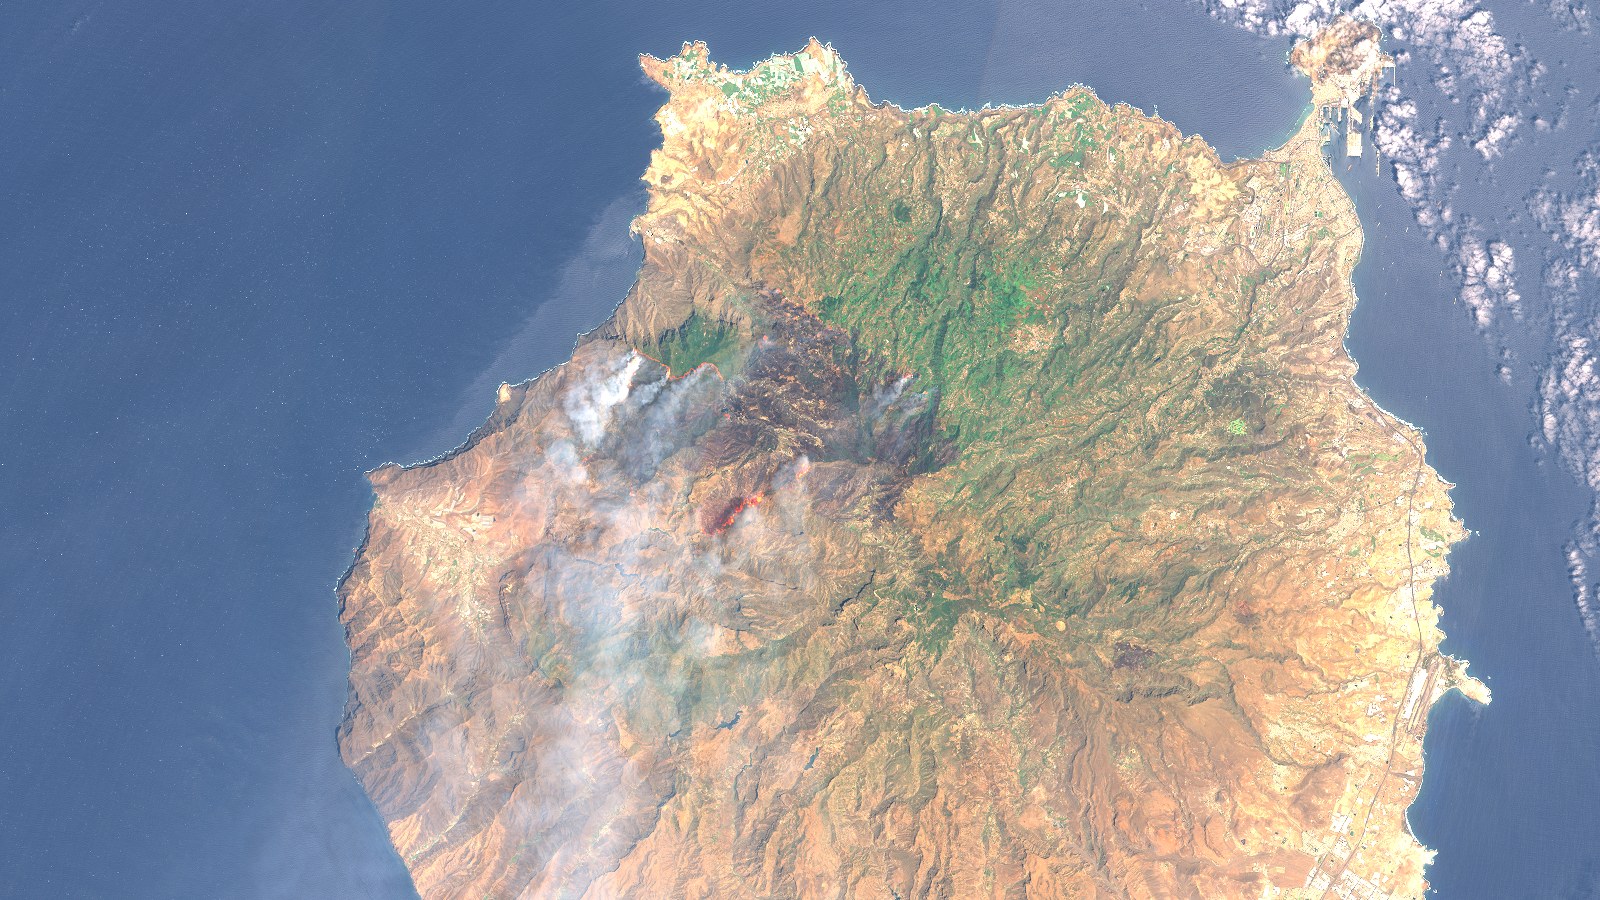
Smoke over Gran Canaria, Spain, during the wildfire of August 2019, Natural colour with infrared bands · Sentinel-2 L1C, 19 August 2019
Smoke over Gran Canaria, Spain, during the wildfire of August 2019Natural colour with infrared bands · Sentinel-2 L1C, 19 August 2019
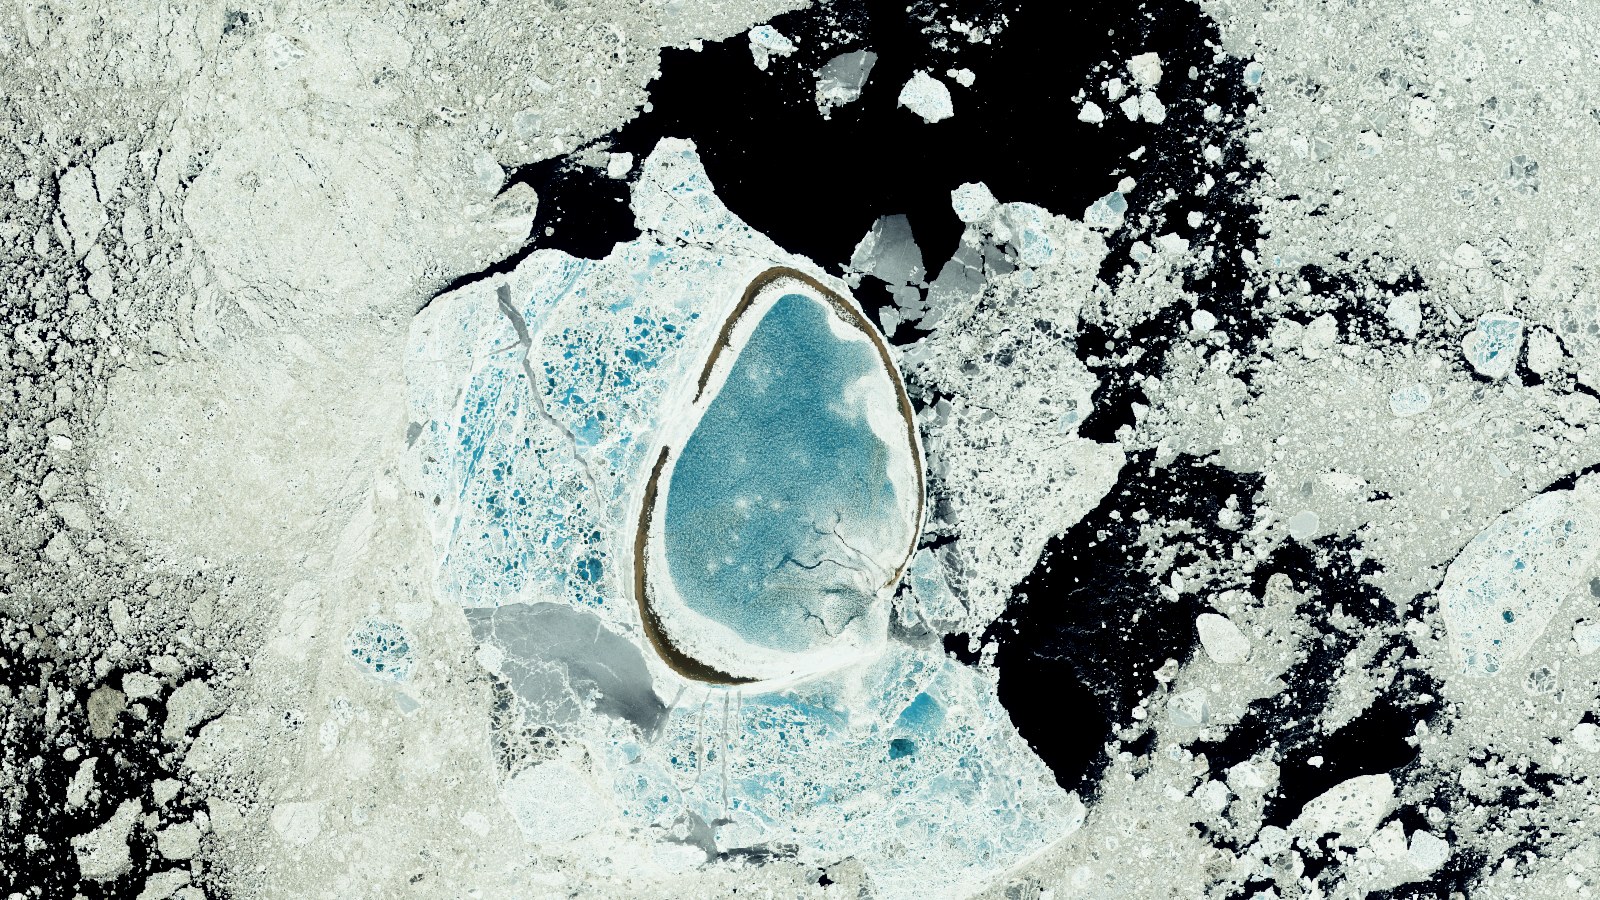
Peschany Island in the sea ice, Laptev Sea, Siberia, Natural colour with short-wave infrared, my recipe · Sentinel-2 L2A, 14 June 2020
Peschany Island in the sea ice, Laptev Sea, SiberiaNatural colour with short-wave infrared, my recipe · Sentinel-2 L2A, 14 June 2020
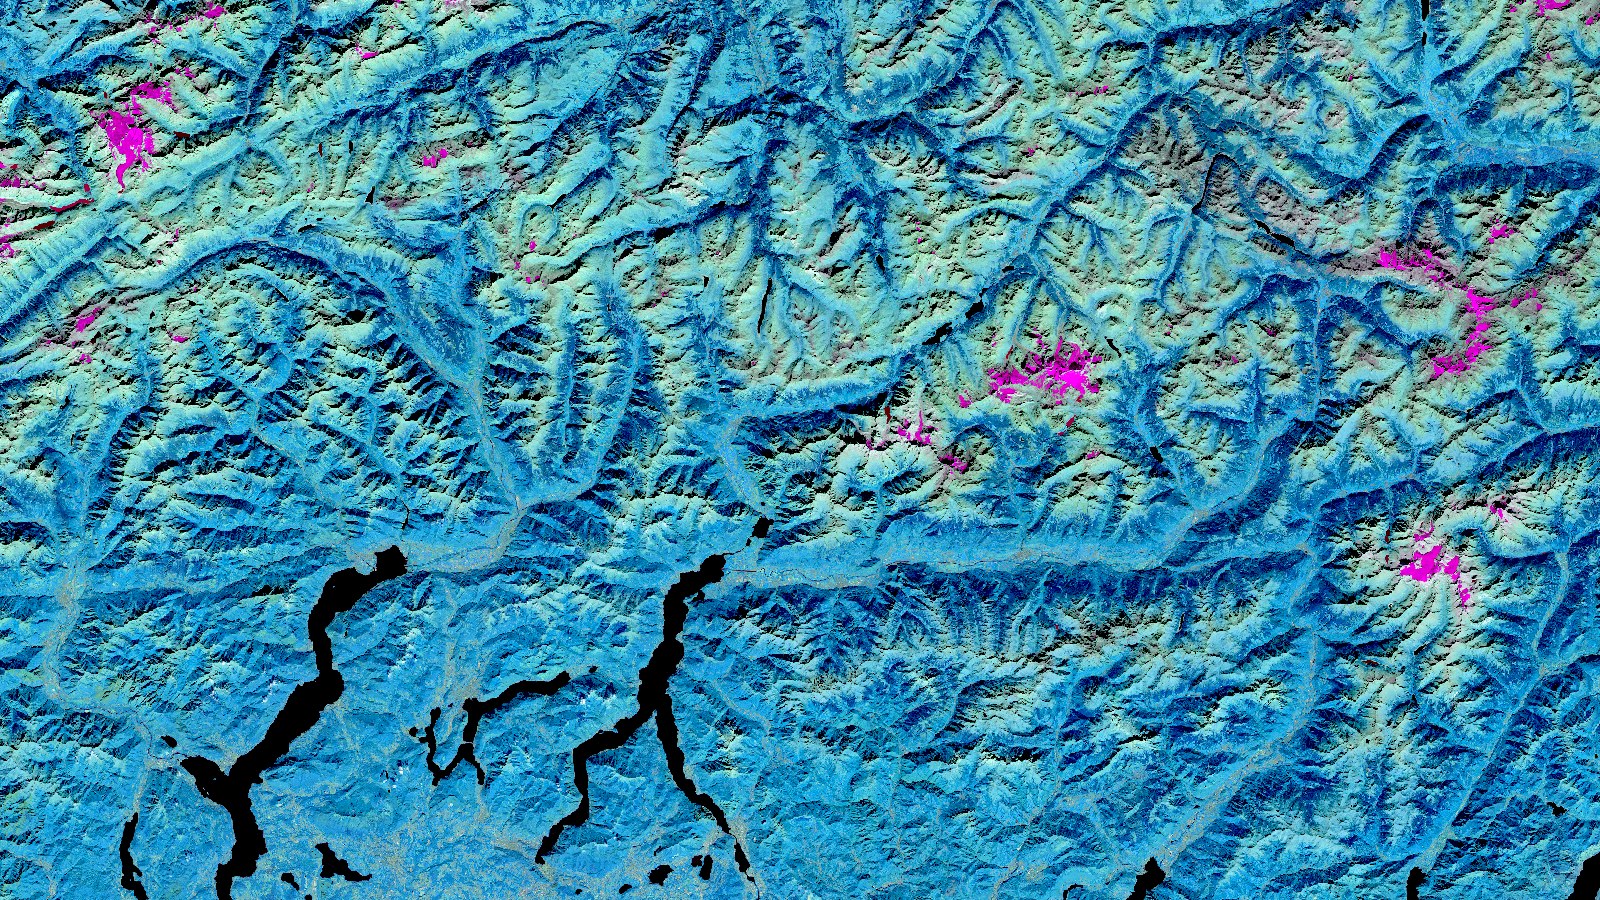
The central Alps above Lakes Maggiore, Lugano, and Como, Infrared false colour, my recipe · Sentinel-2 L1C, 27 September 2026
The central Alps above Lakes Maggiore, Lugano, and ComoInfrared false colour, my recipe · Sentinel-2 L1C, 27 September 2026
Data visualisation, summer 2026

Summer 2026, how far from normal, country by country.

All the data visualisation →
JuneJulyAugust

Monthly 2 m temperature anomaly against 1991–2020, from ERA5 at 0.25° over land only, and from ERA5-Land at 0.1° for Malta, with the method of the C3S bulletins applied within each country's border. My calculation, not an official figure, computed on 13 September 2026. Data: ERA5, Copernicus Climate Change Service at ECMWF.

Data visualisation, live · data to 26 September 2026

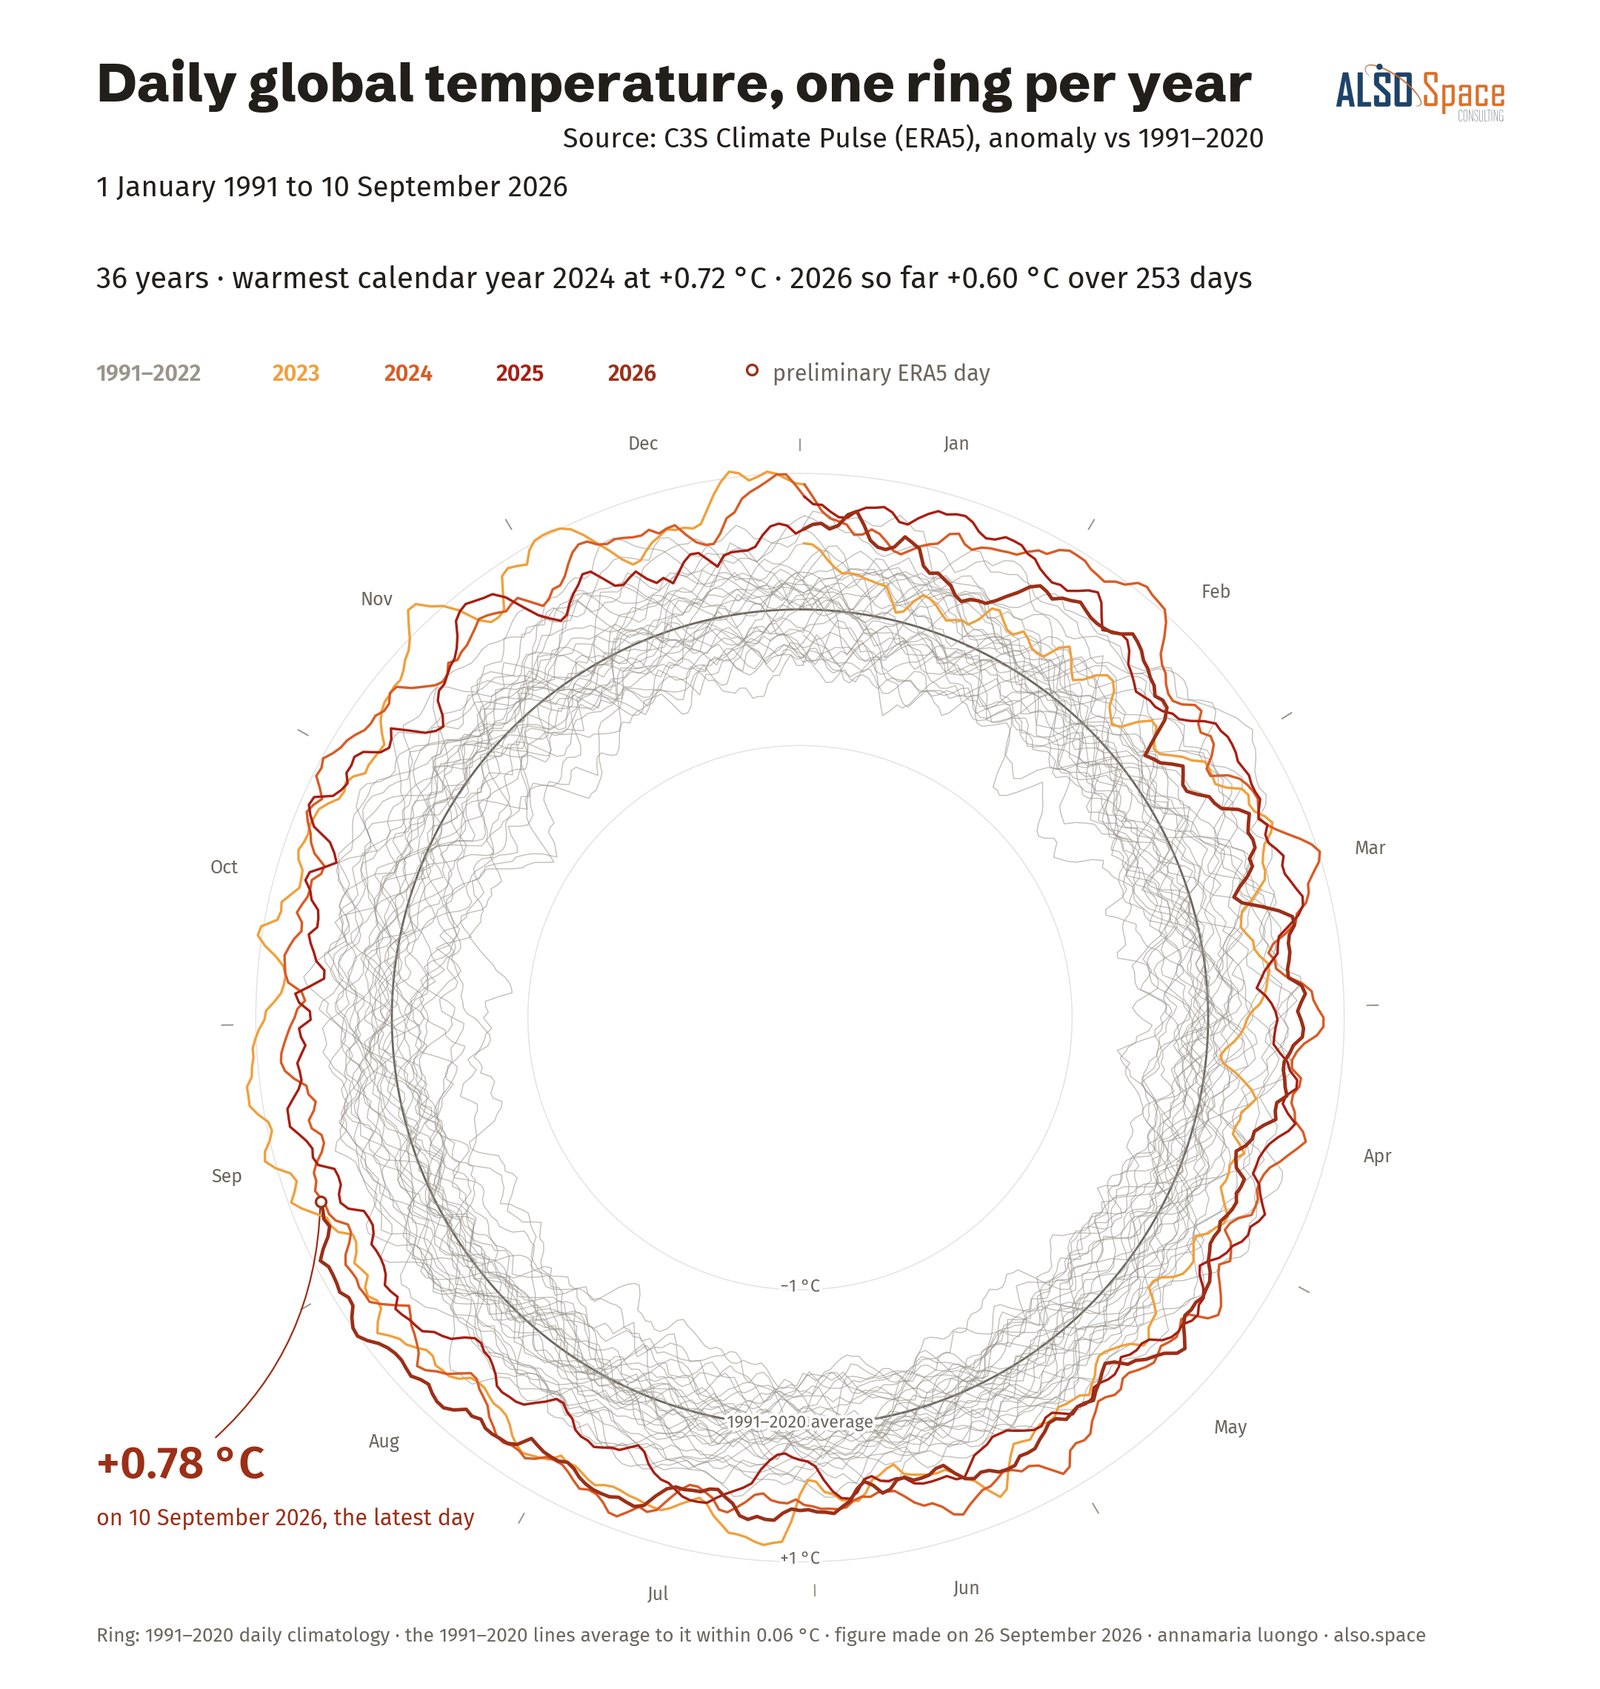
Thirty-six years of daily global temperature, one ring per year.

Each ring is one year of daily global 2 m temperature against the 1991–2020 average: the angle gives the day of the year, and the radius gives the anomaly. The 32 grey rings, from 1991 to 2022, form a swarm; since 2023, 66% of the days have been warmer than the same day in every year of the swarm.

1991
+0.88 °Con 26 September 2026, the latest day, still preliminary. The warmest ring is 2024; over the first 269 days of the year, 2026 is 0.09 °C below it.

Daily global mean 2 m temperature anomaly against 1991–2020, from ERA5 in the Climate Pulse of the Copernicus Climate Change Service, updated every day, data to 26 September 2026. My drawing of the official series; the latest days are preliminary.

Data visualisation, fourteen mechanisms

Multiple ways to visualise Copernicus data.

All the data visualisation →
01 / 14
Daily global temperature, one ring per year
01 · cycle clock · C3S Climate Pulse
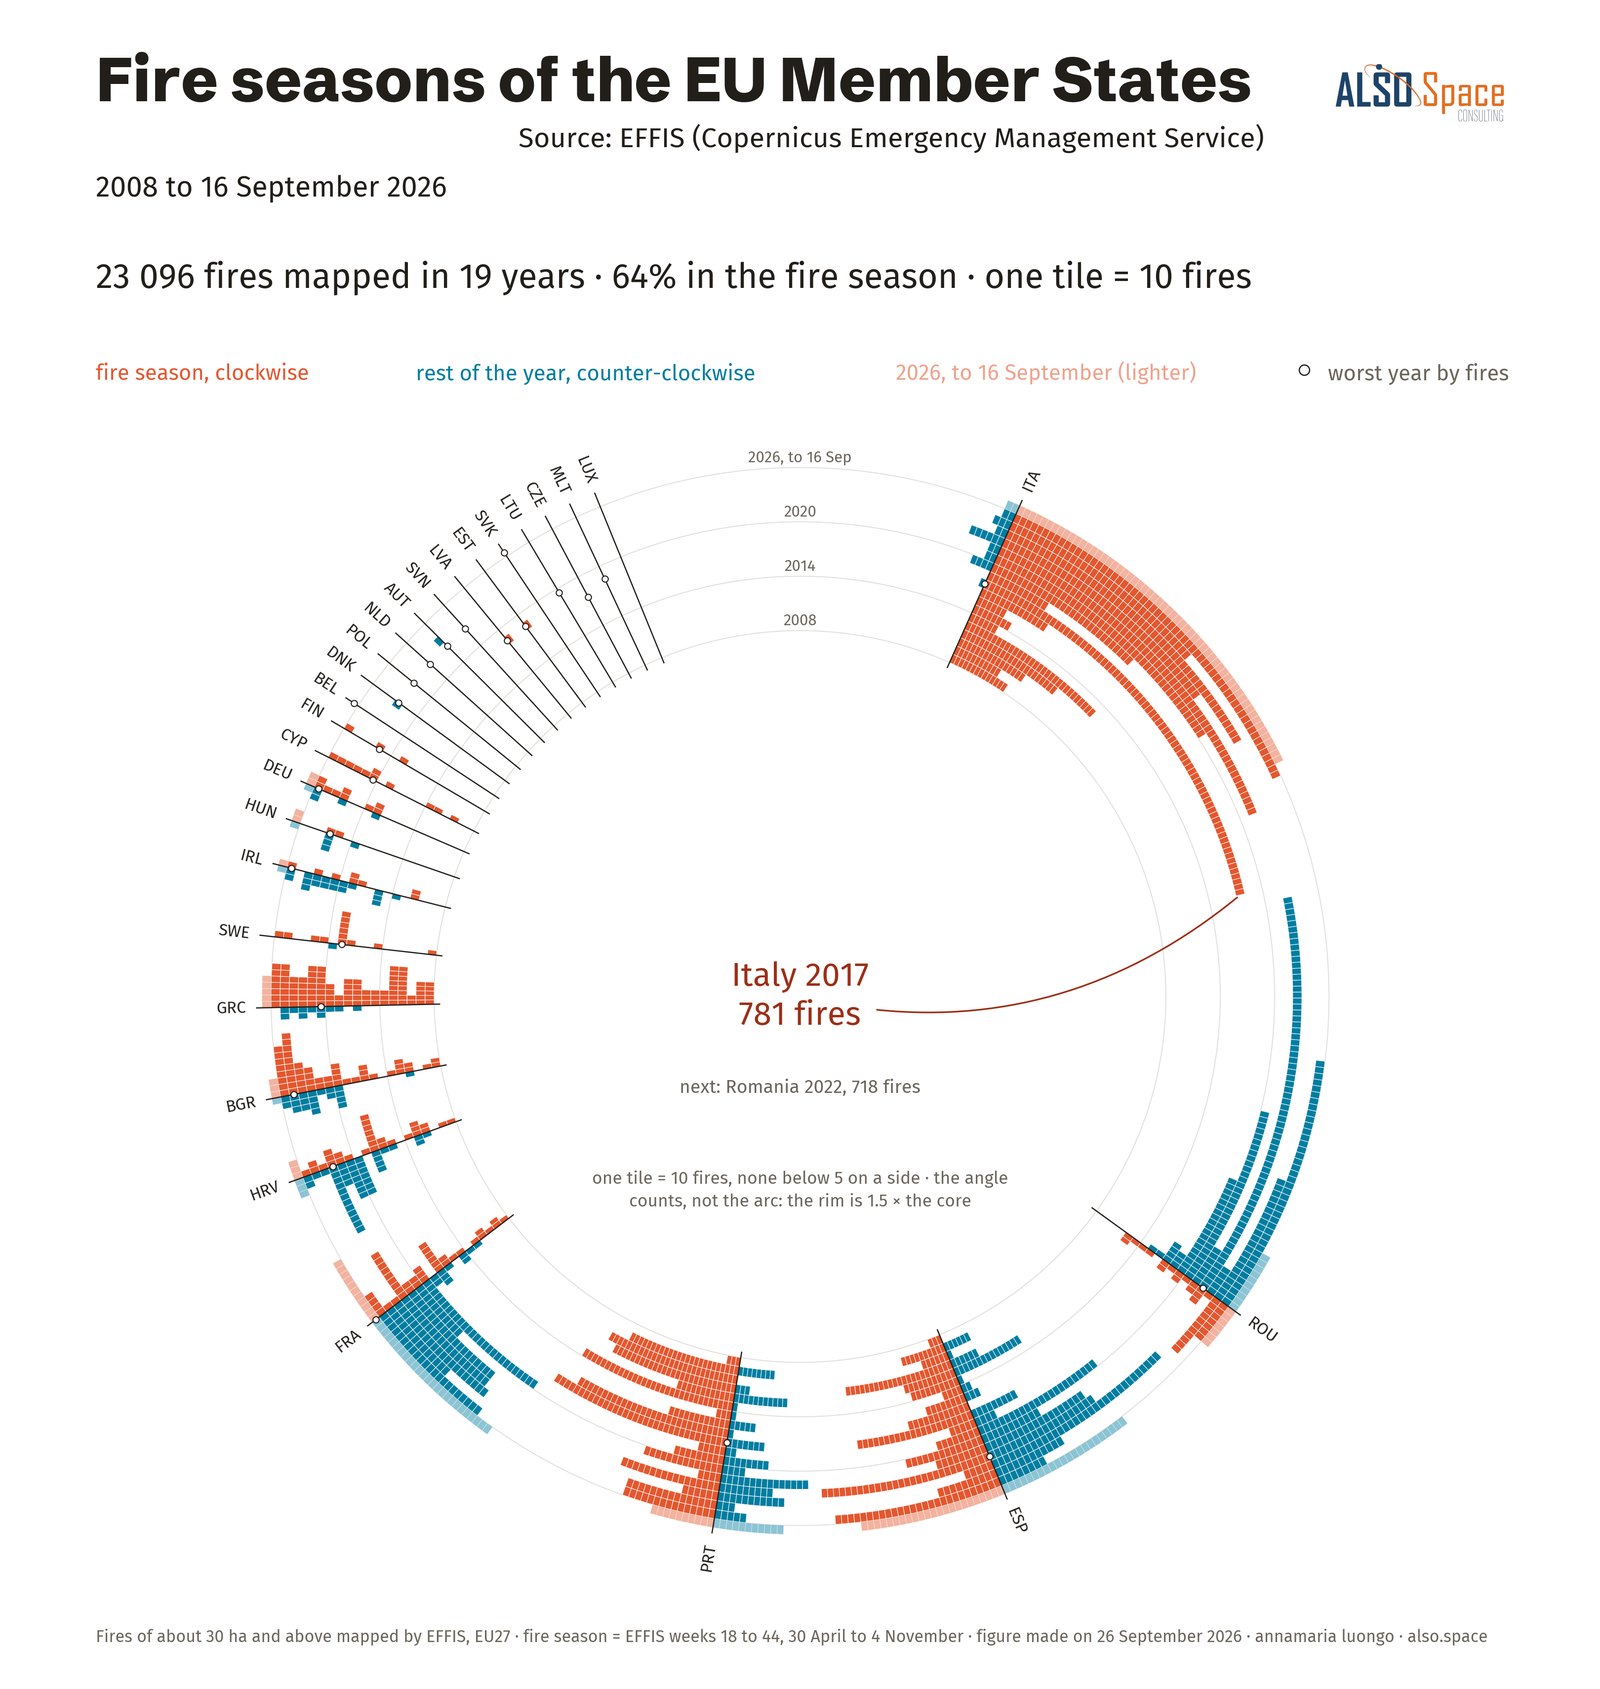
Fire seasons of the EU Member States
02 · time rings · EFFIS, weekly fires
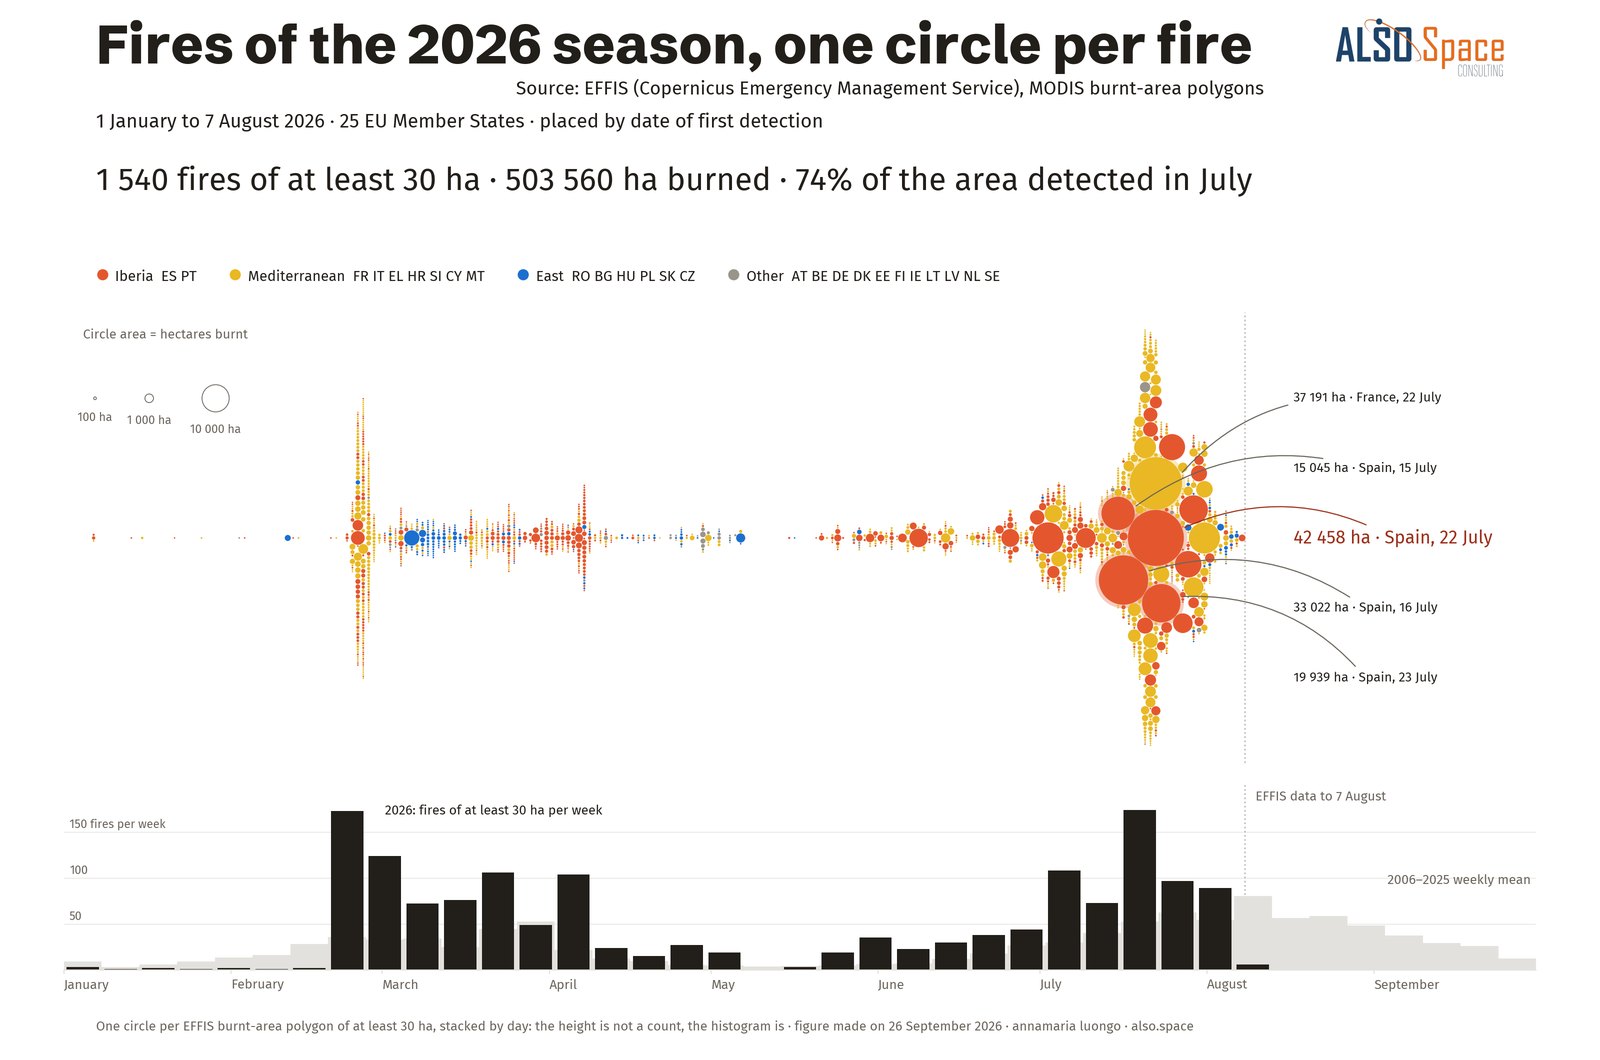
Fires of the 2026 season, one circle per fire
03 · unit swarm · EFFIS 2026 polygons
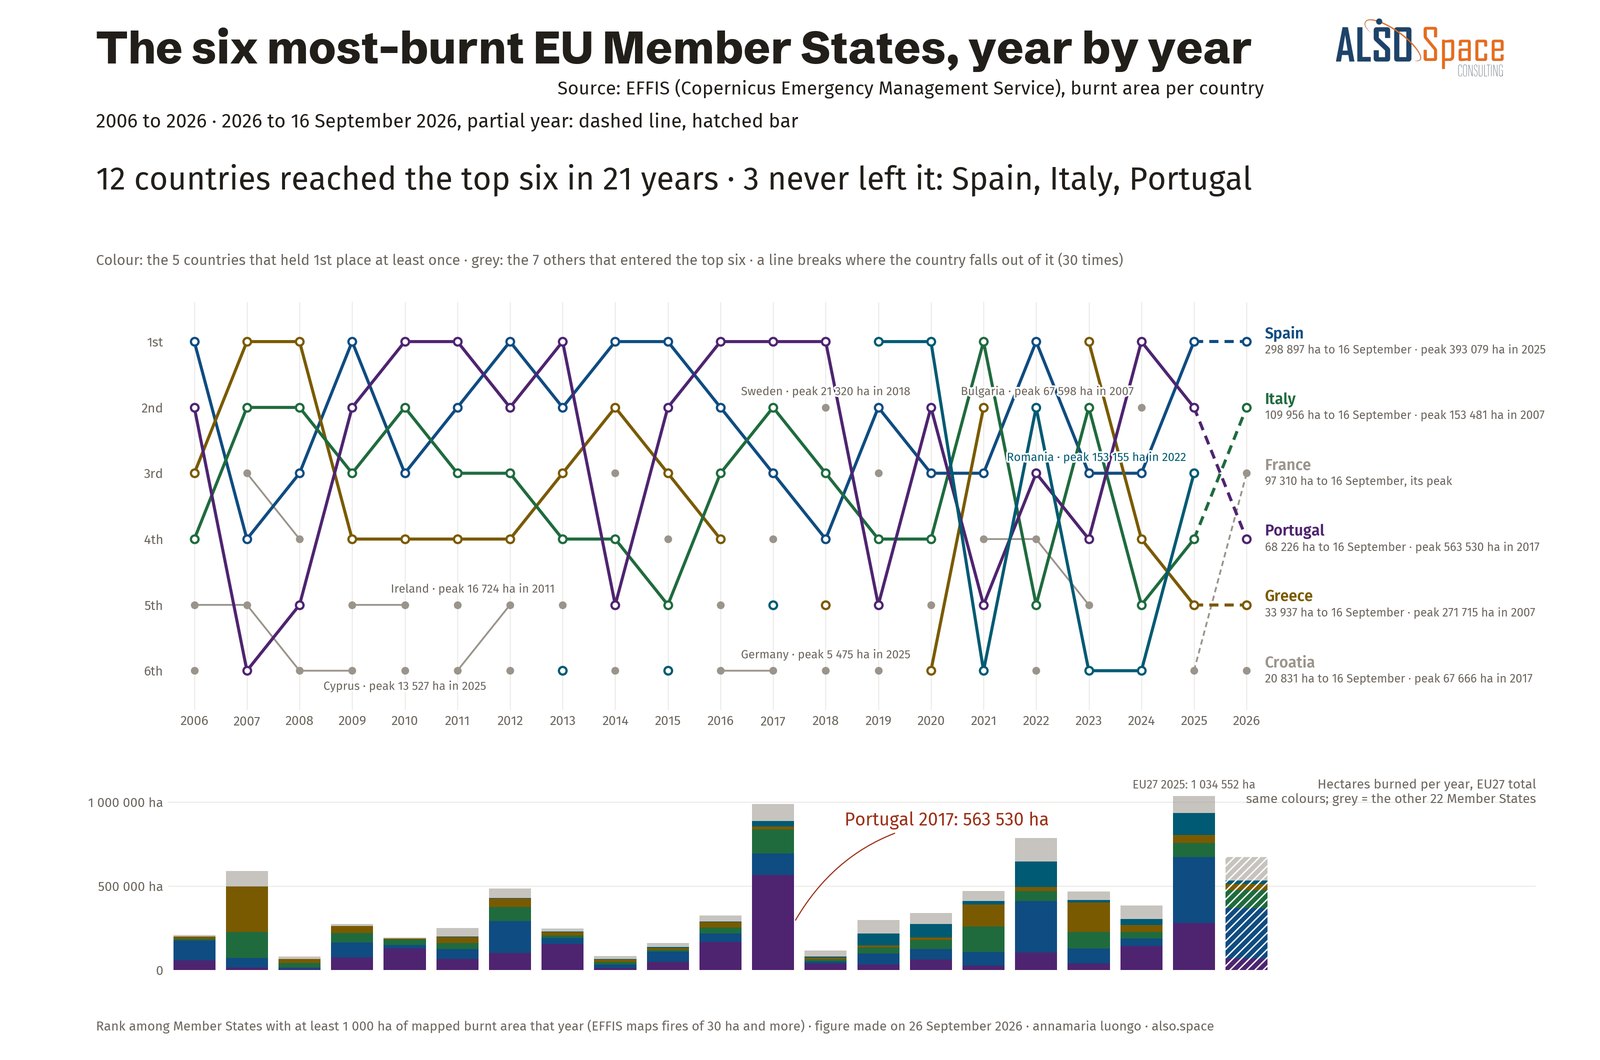
The six most-burnt EU Member States, year by year
04 · entity ribbons · EFFIS by country
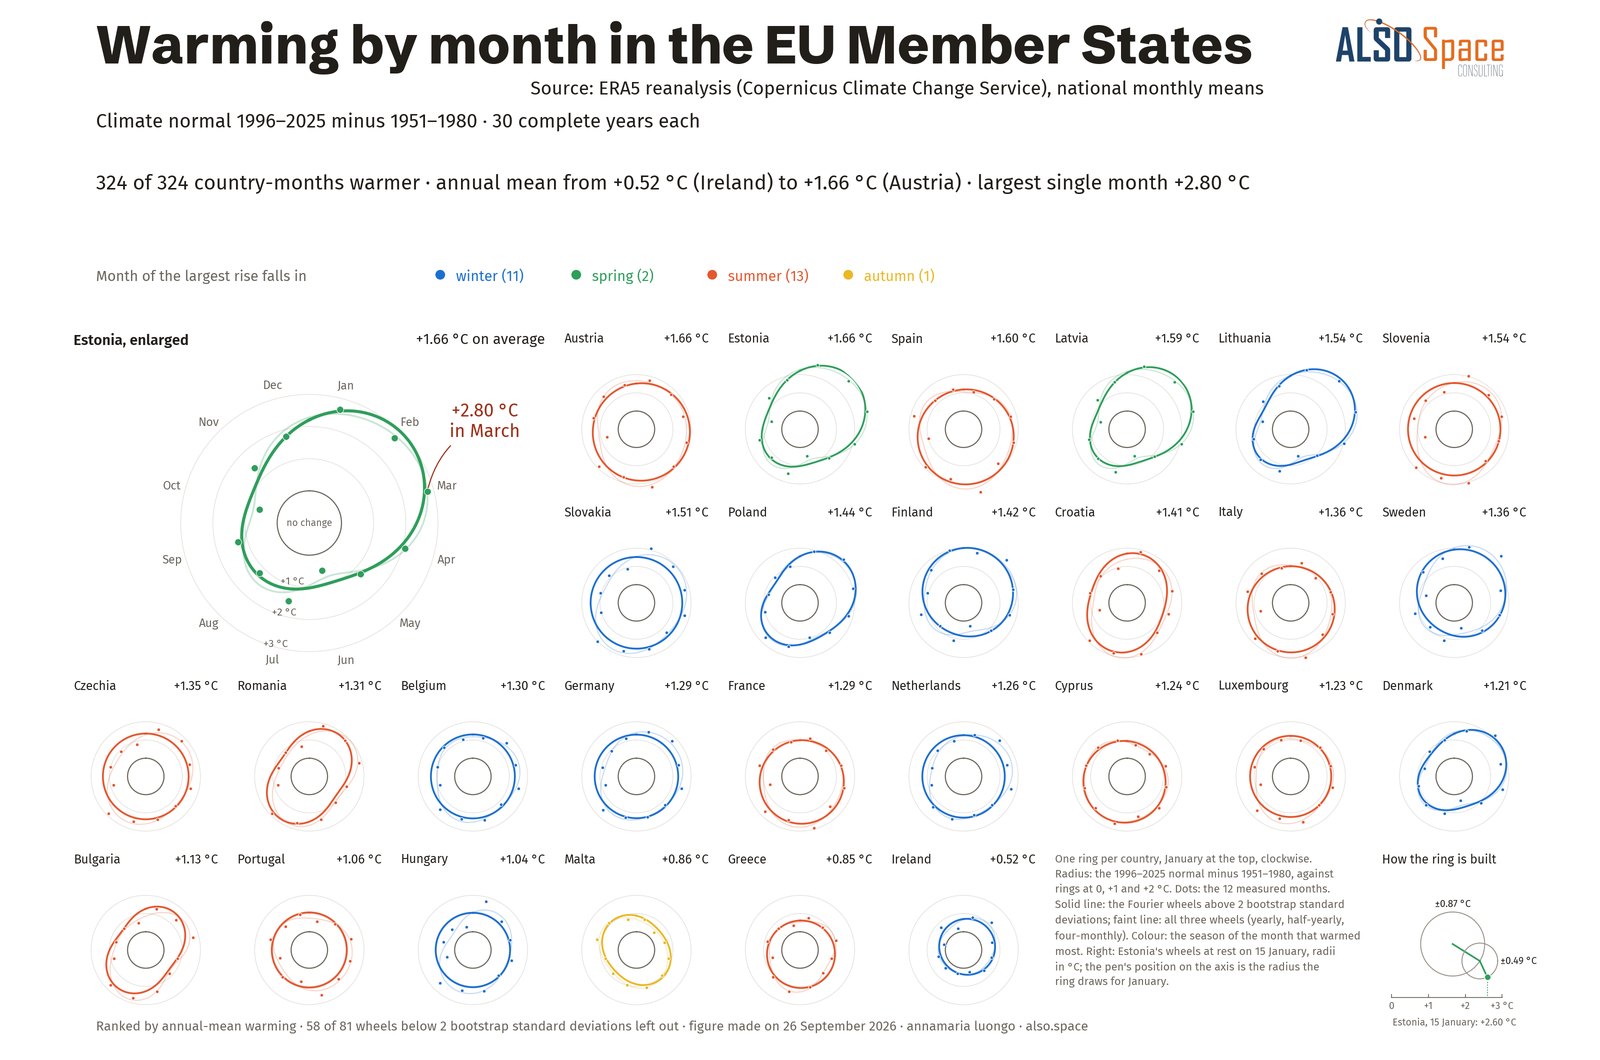
Warming by month in the EU Member States
05 · harmonic curves · ERA5 by country
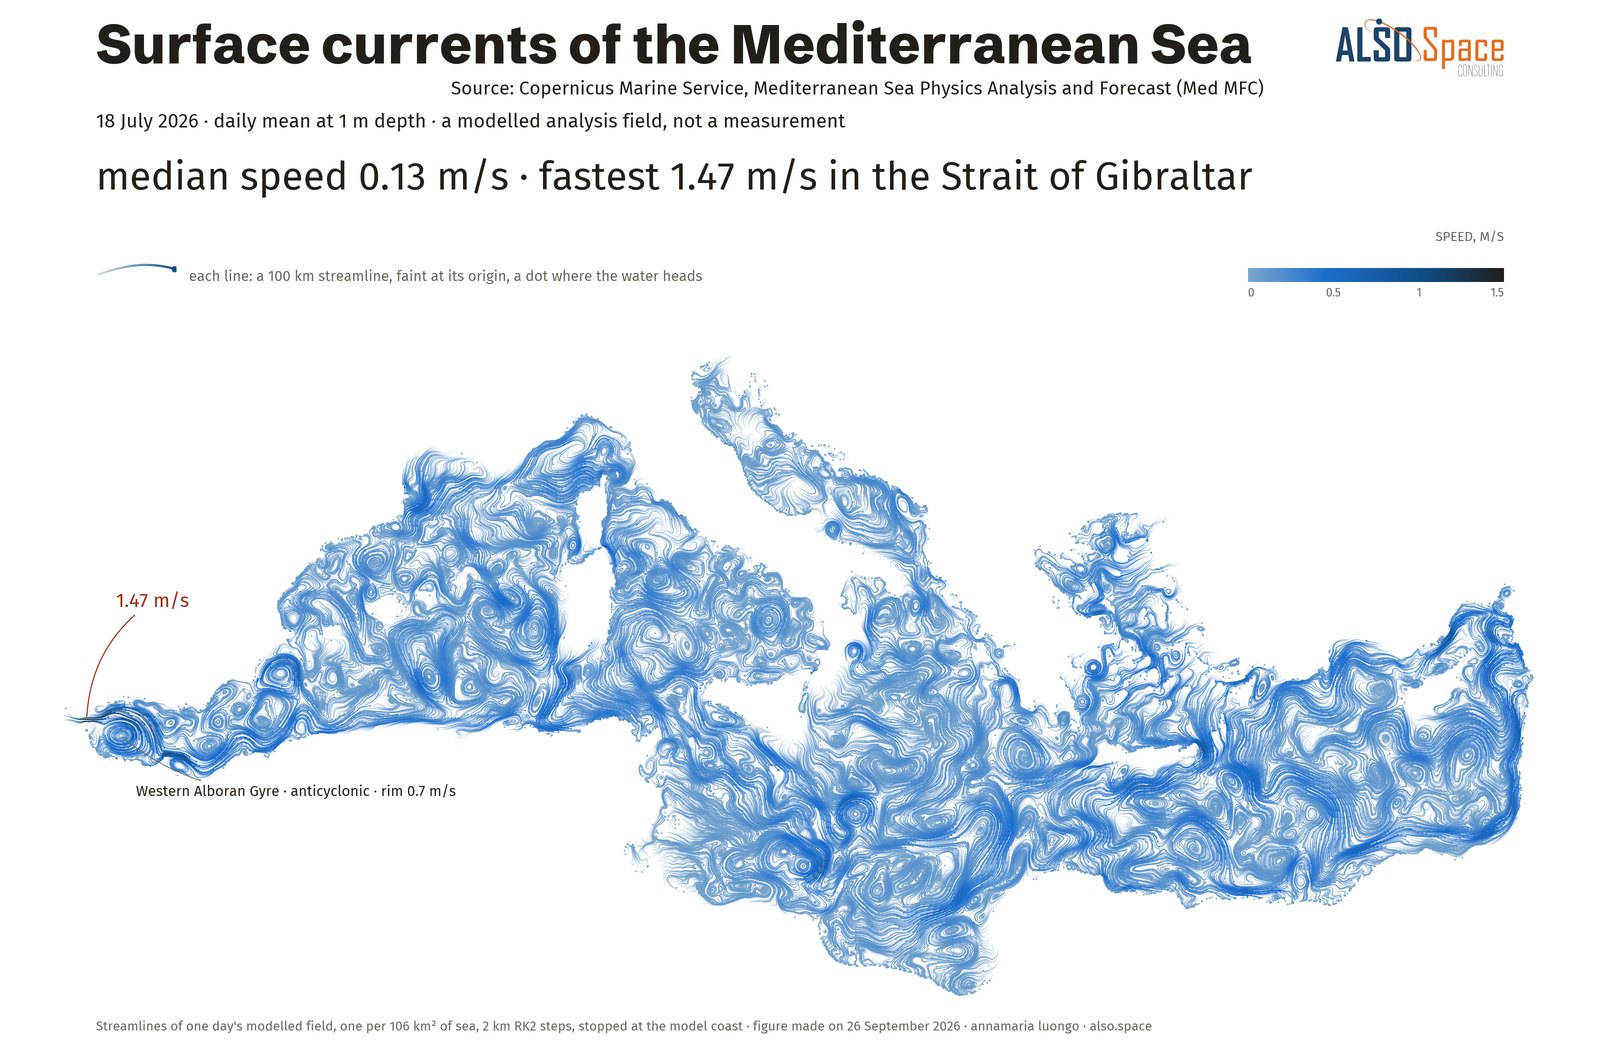
Surface currents of the Mediterranean Sea
06 · field trajectories · Copernicus Marine
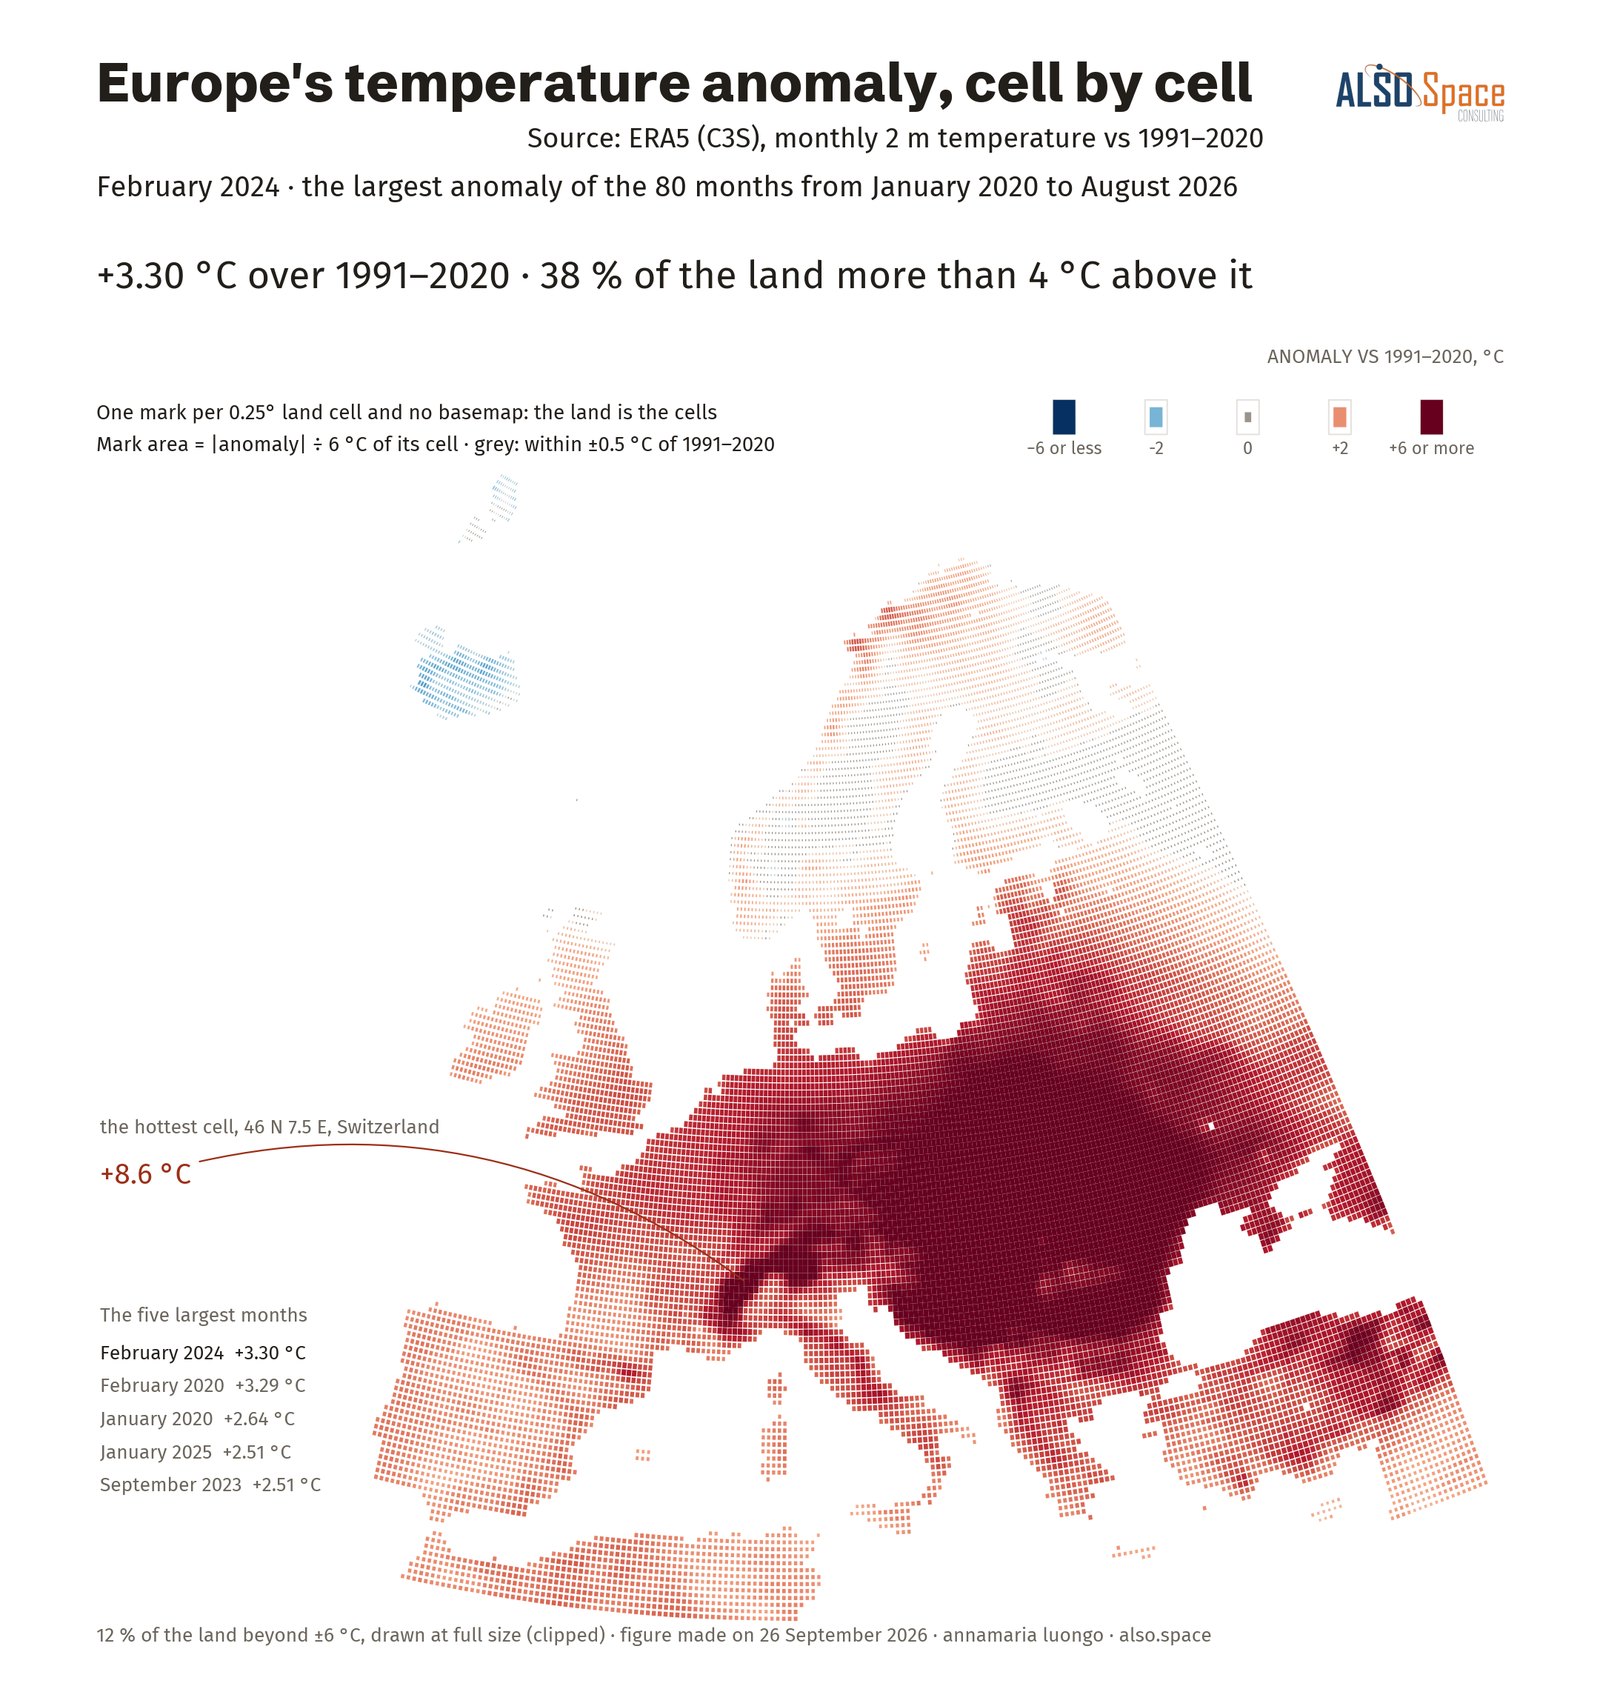
Europe's temperature anomaly, cell by cell
07 · field to cells · ERA5 at 0.25°
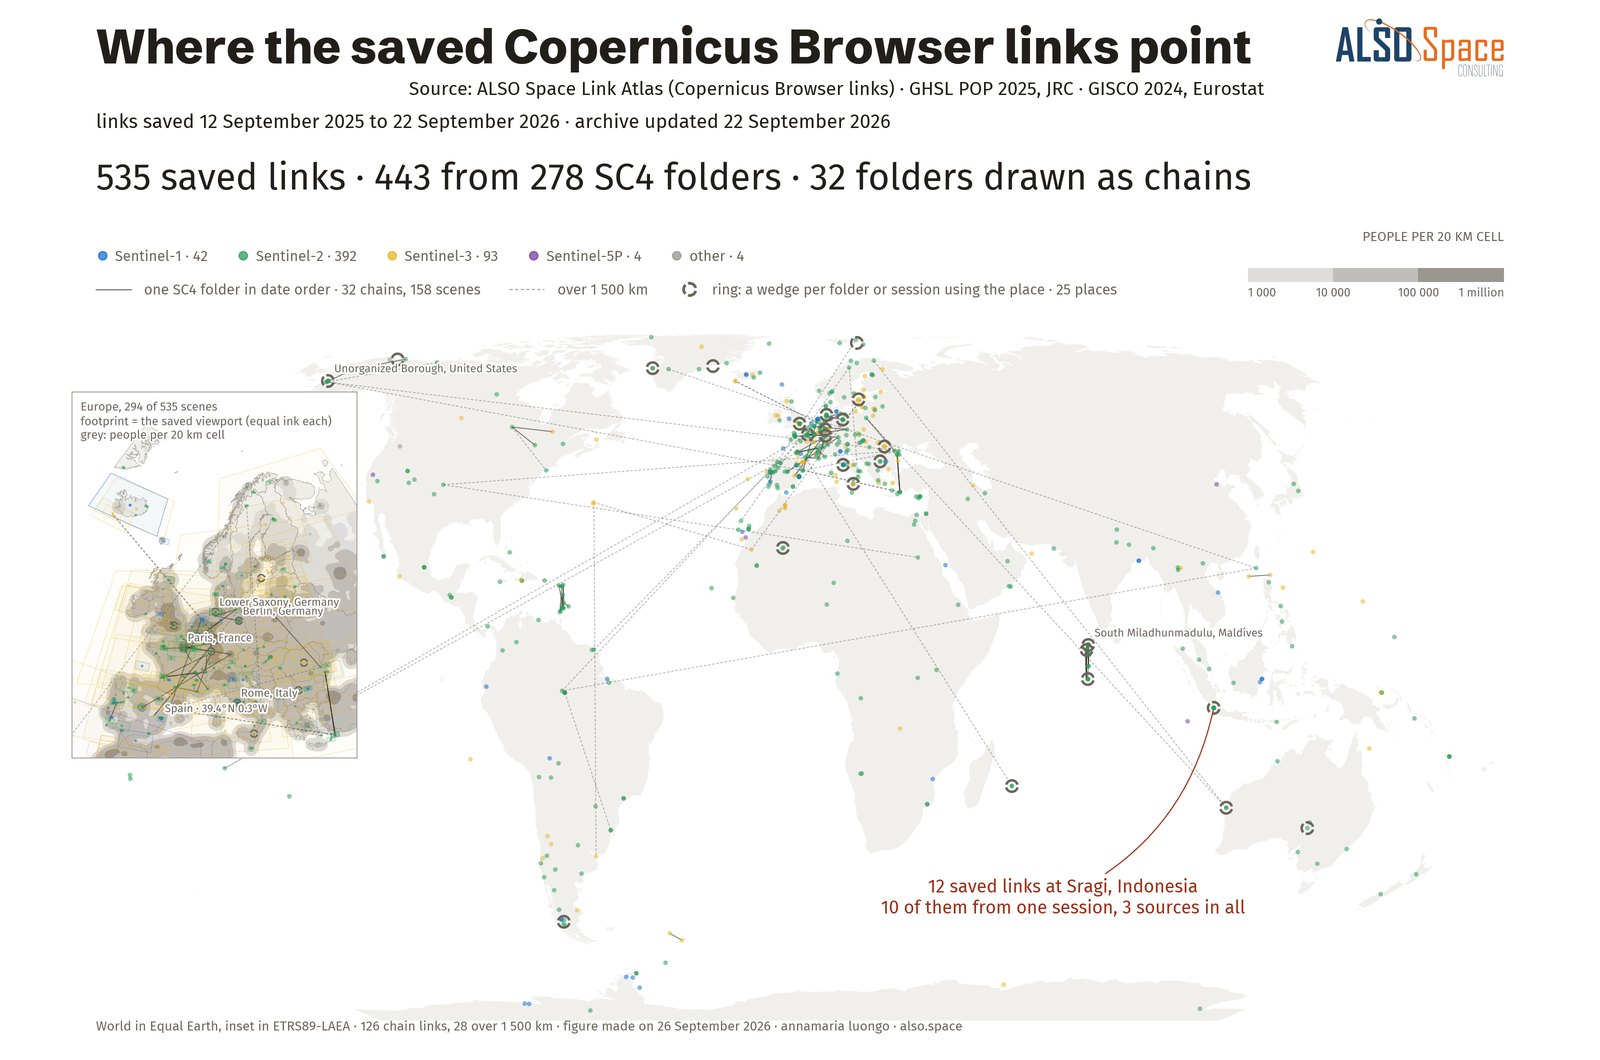
Where the saved Copernicus Browser links point
08 · record point maps · Link Atlas
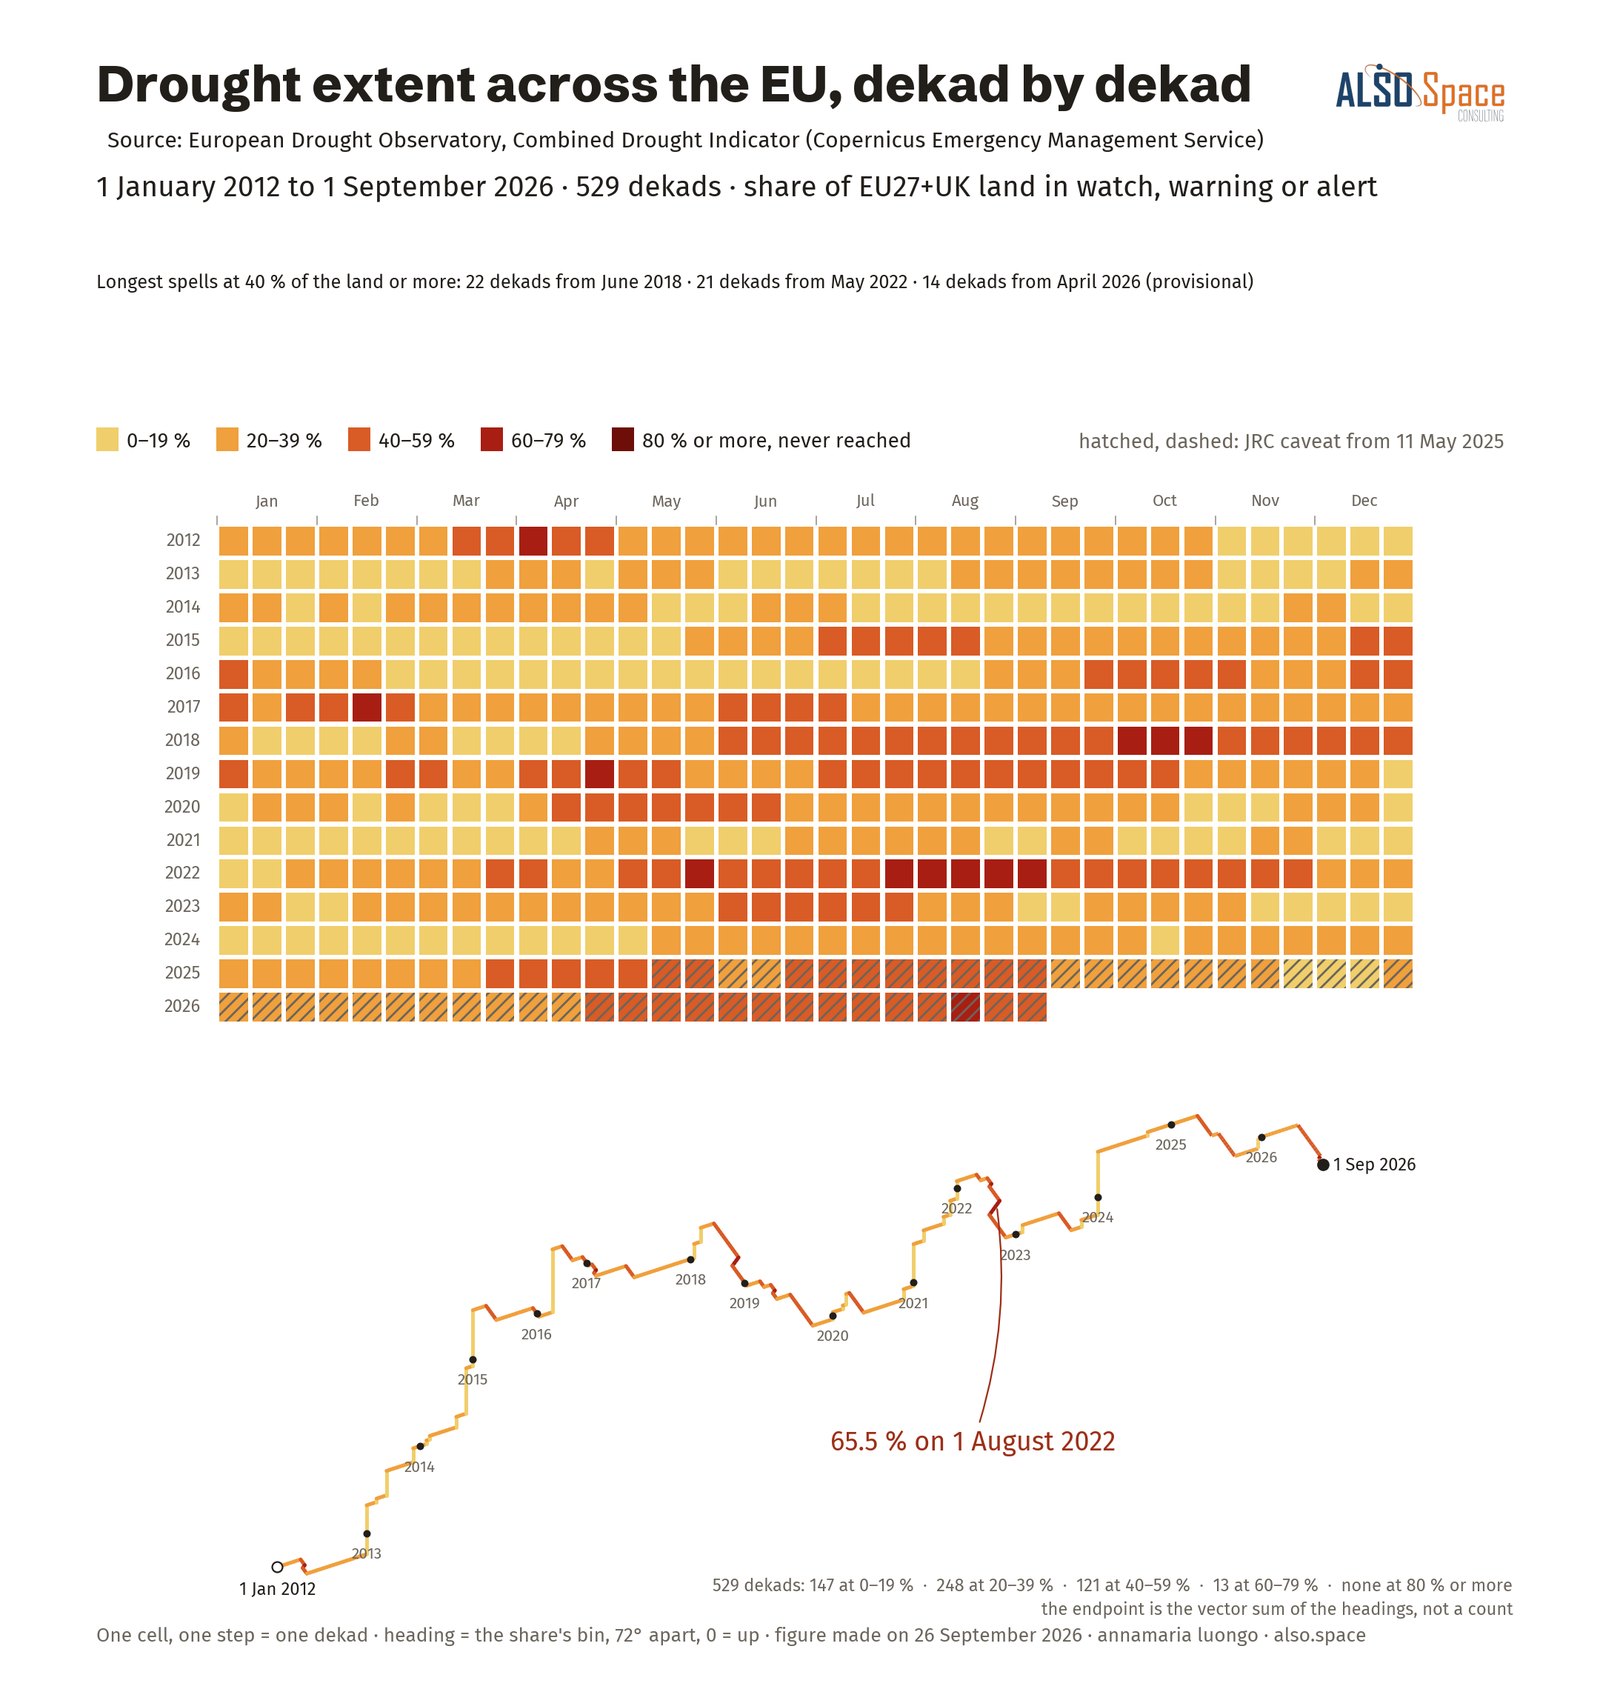
Drought extent across the EU and the United Kingdom, dekad by dekad
09 · sequence paths · EDO drought indicator
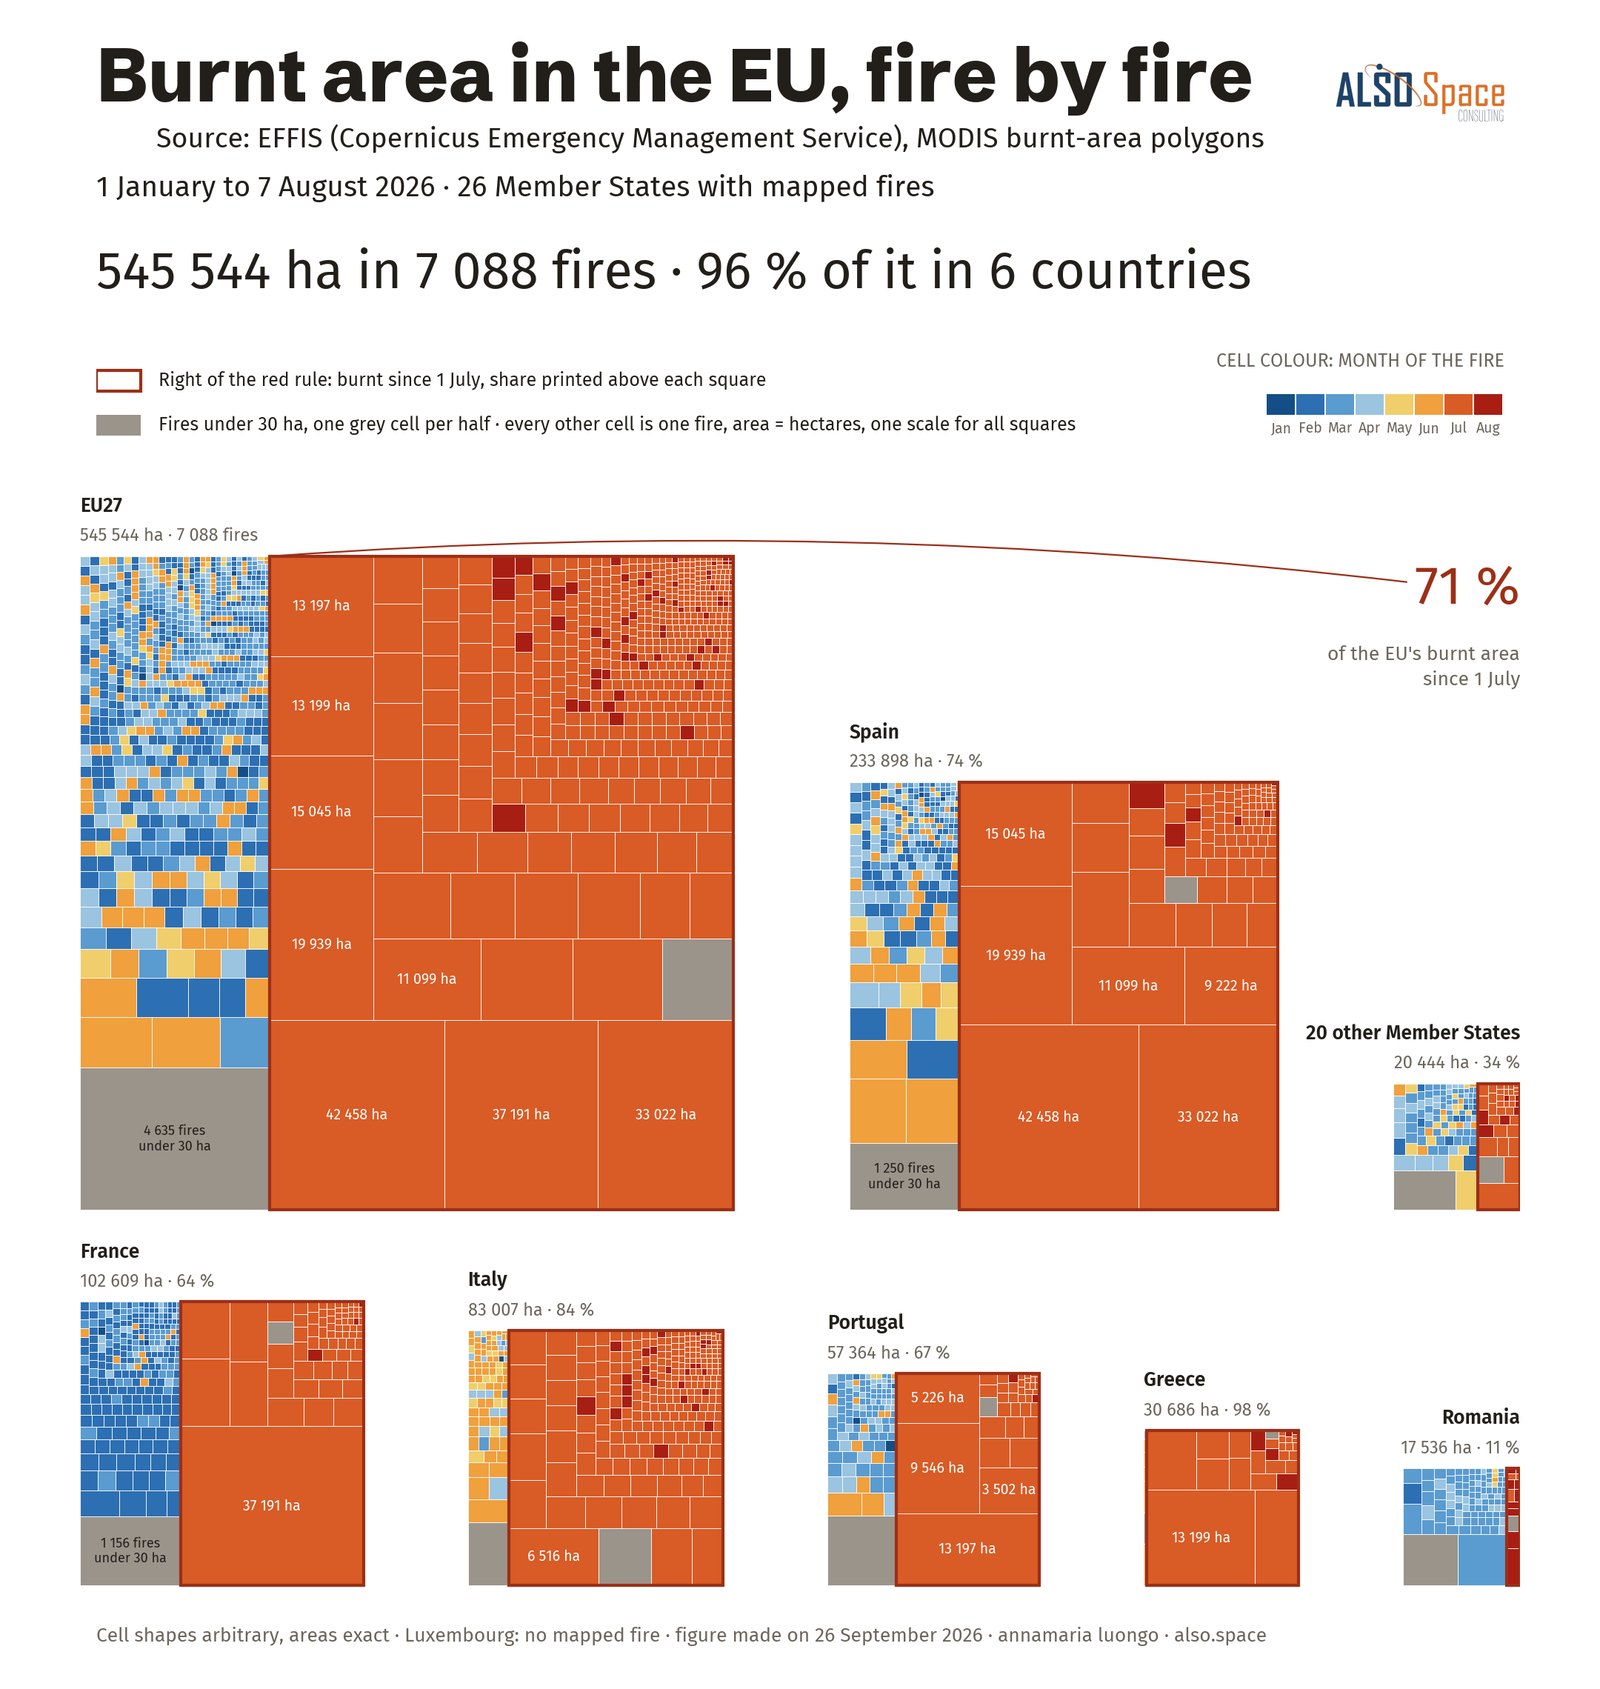
Burnt area in the EU, fire by fire
10 · part of whole · EFFIS 2026
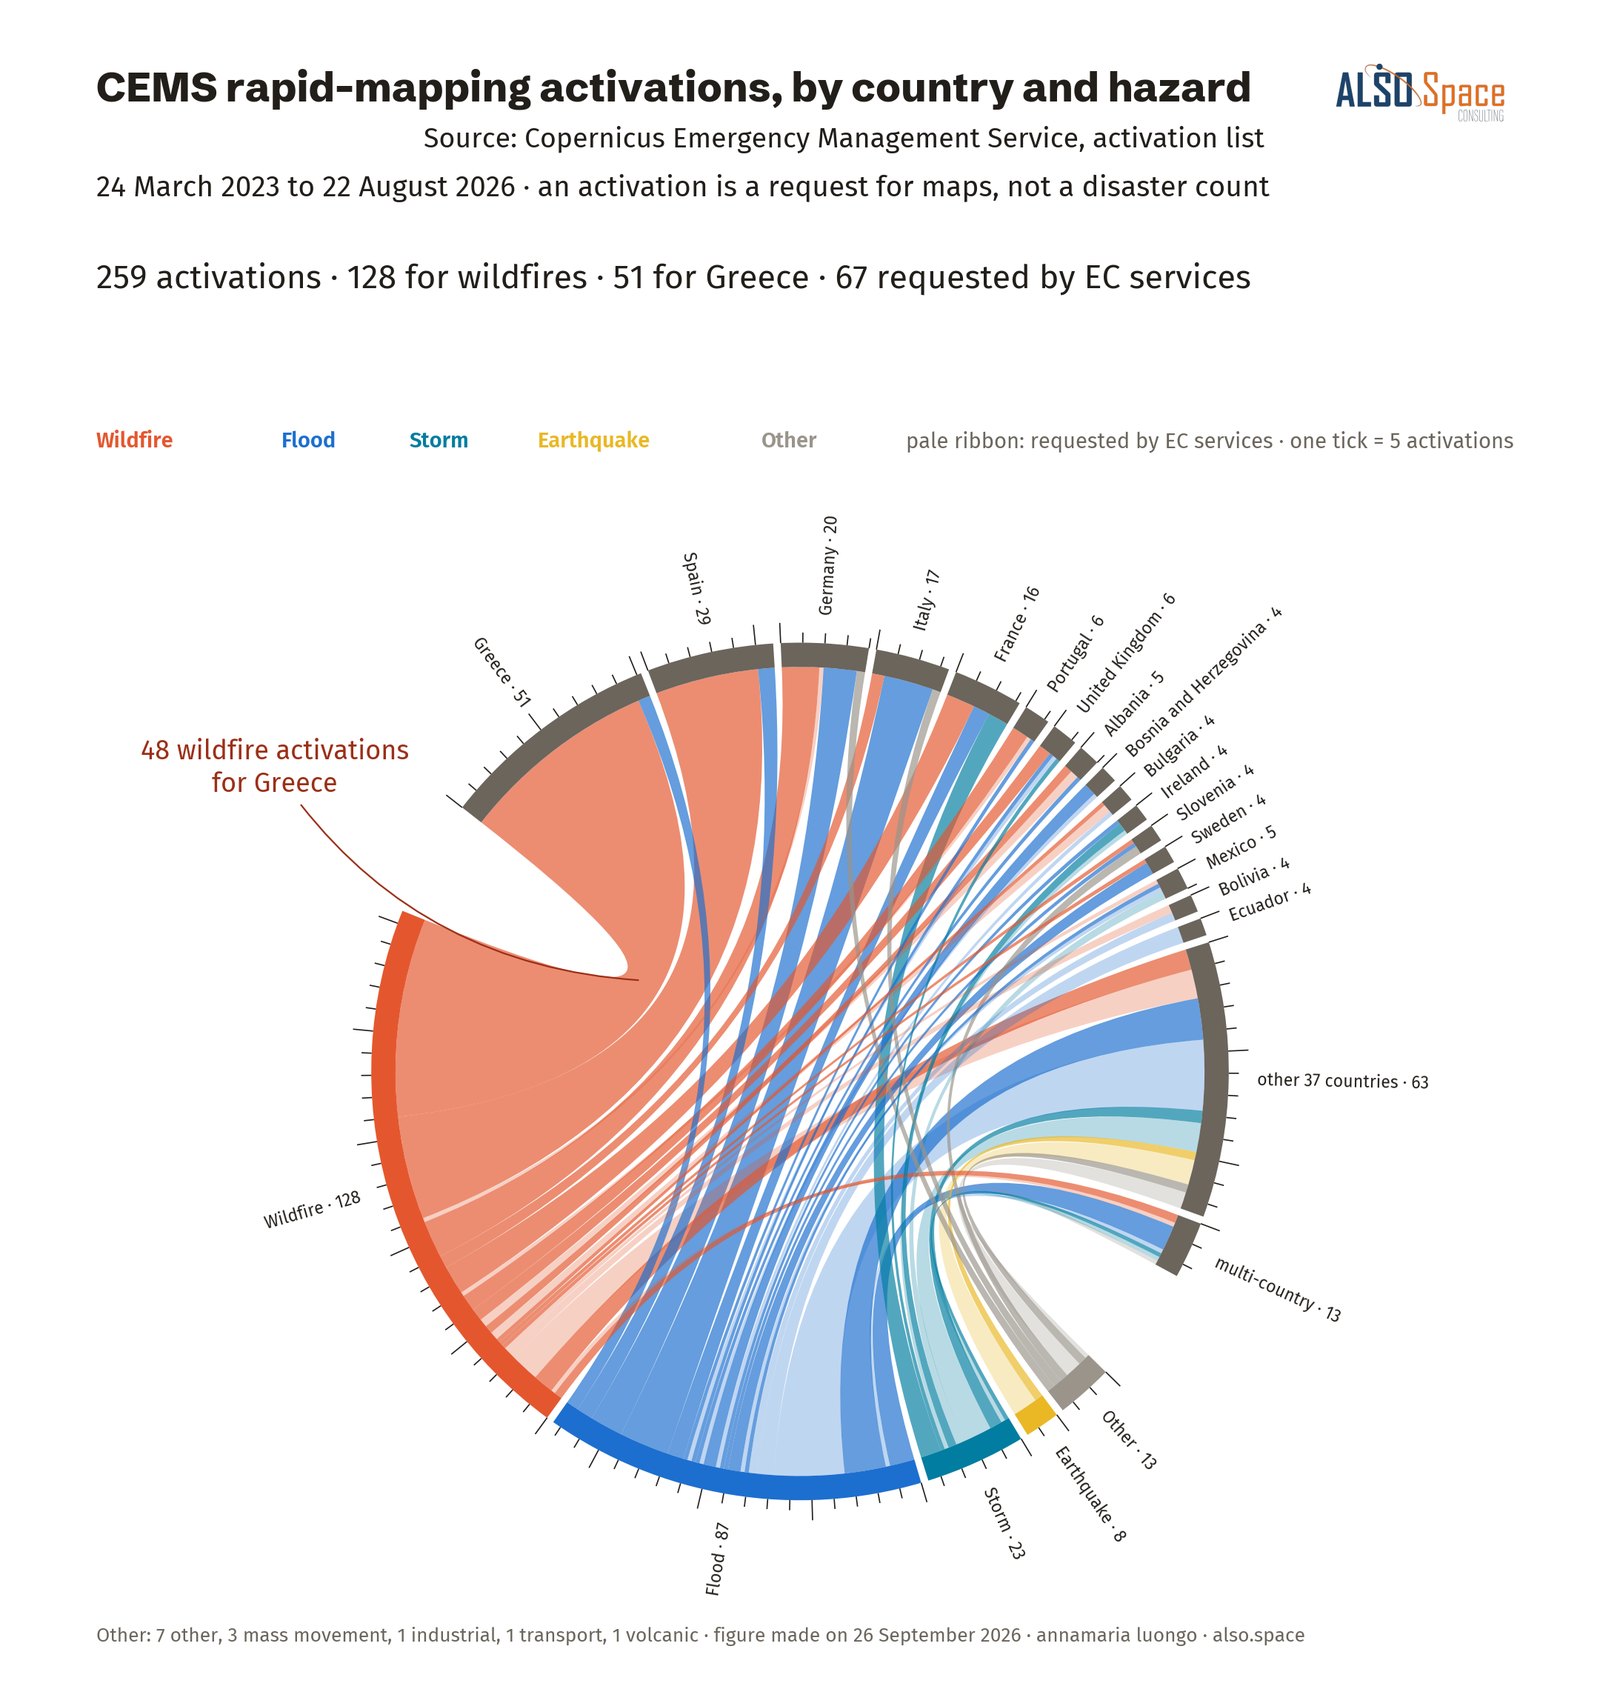
CEMS rapid-mapping activations, by country and hazard
11 · matrix flows · CEMS activations
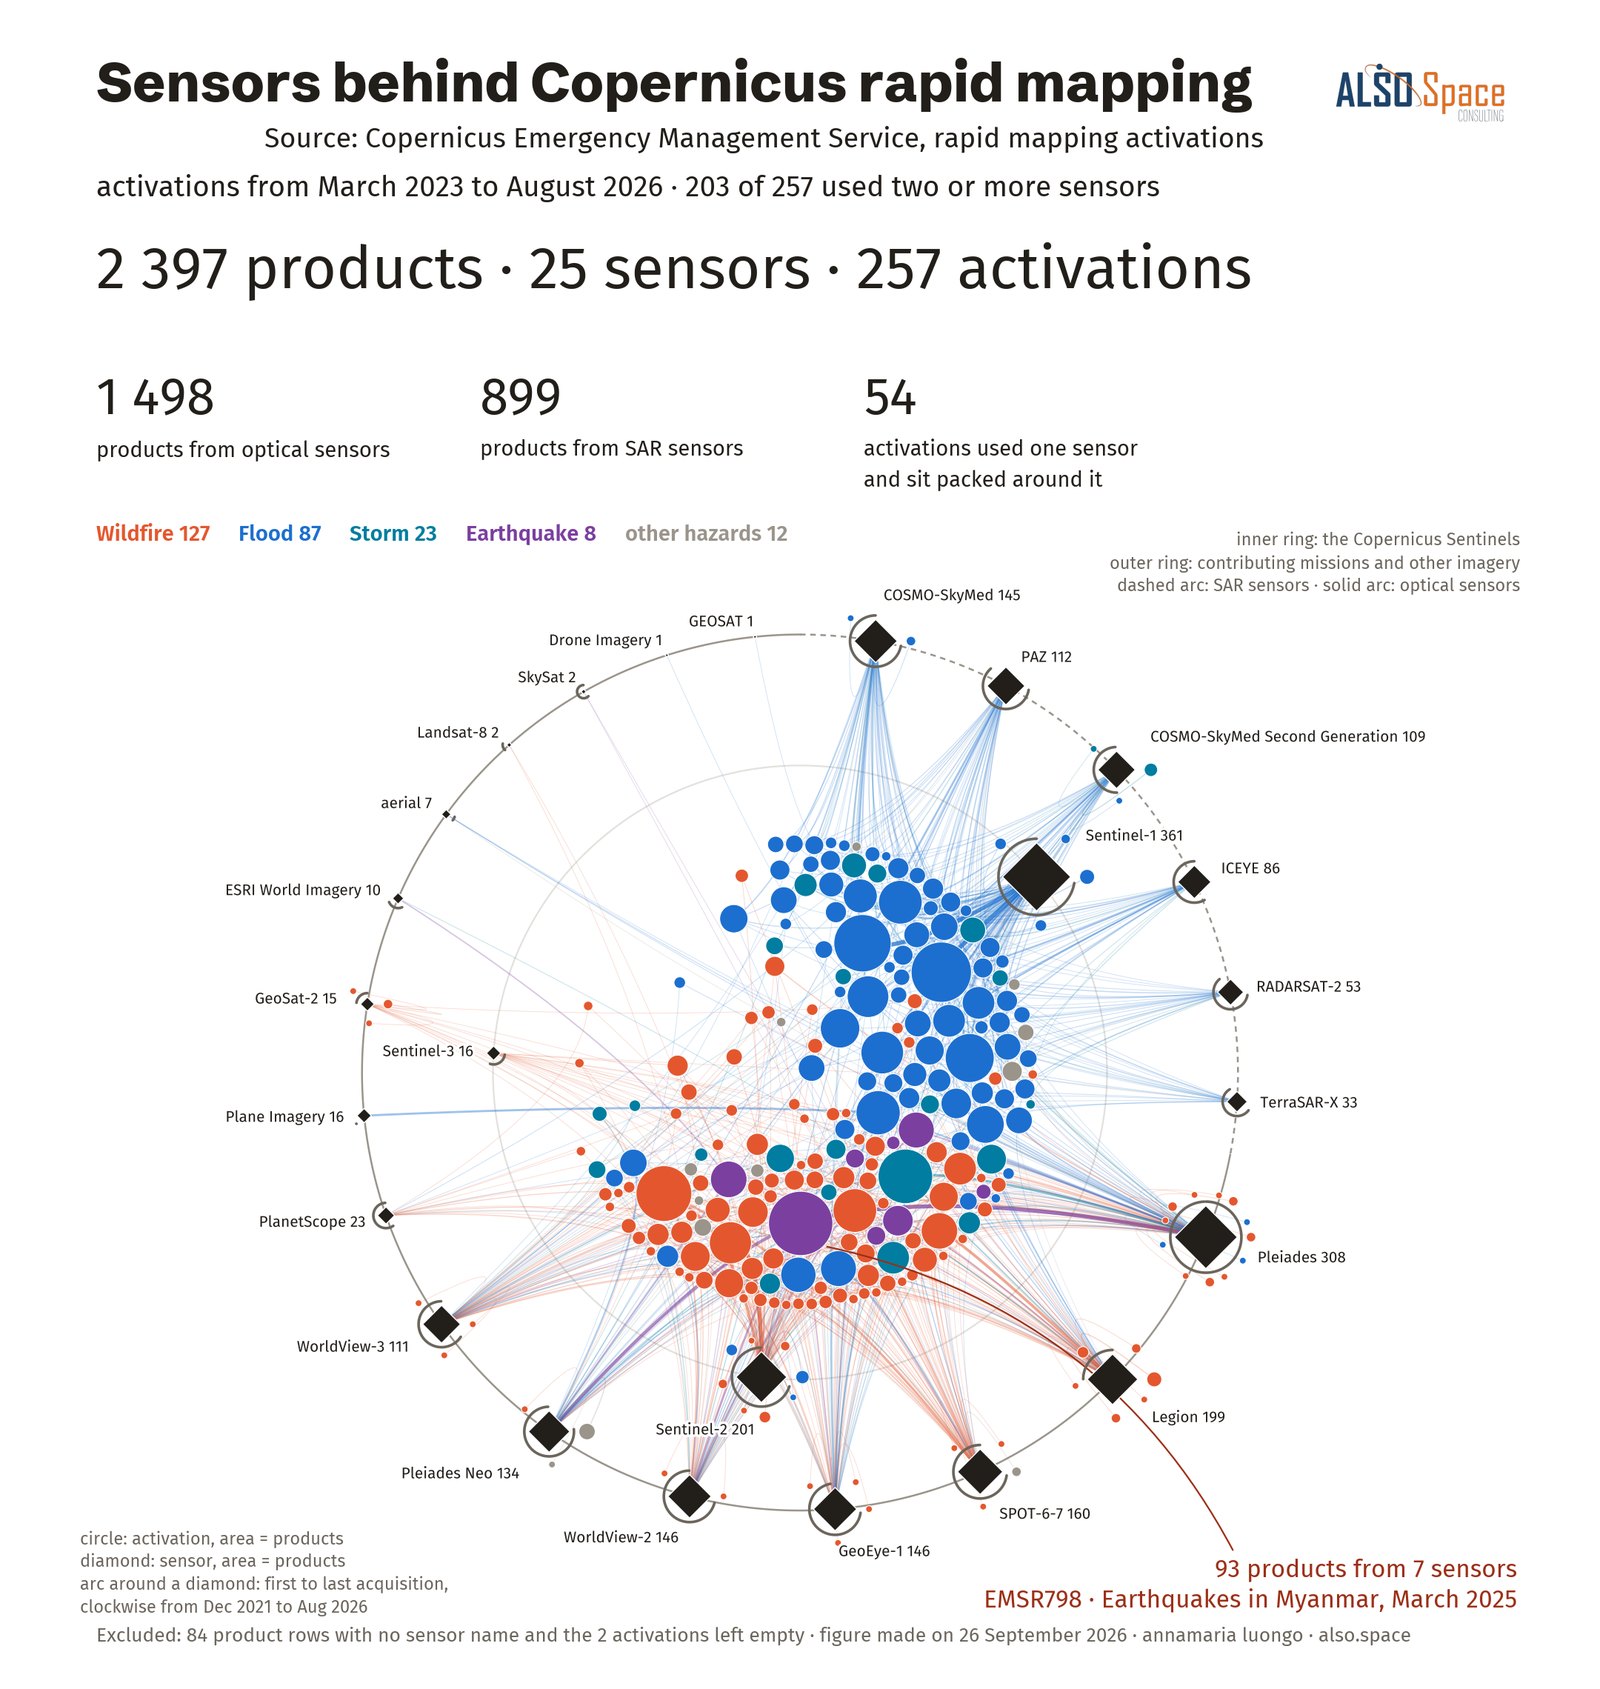
Sensors behind Copernicus rapid mapping
12 · structure networks · CEMS products
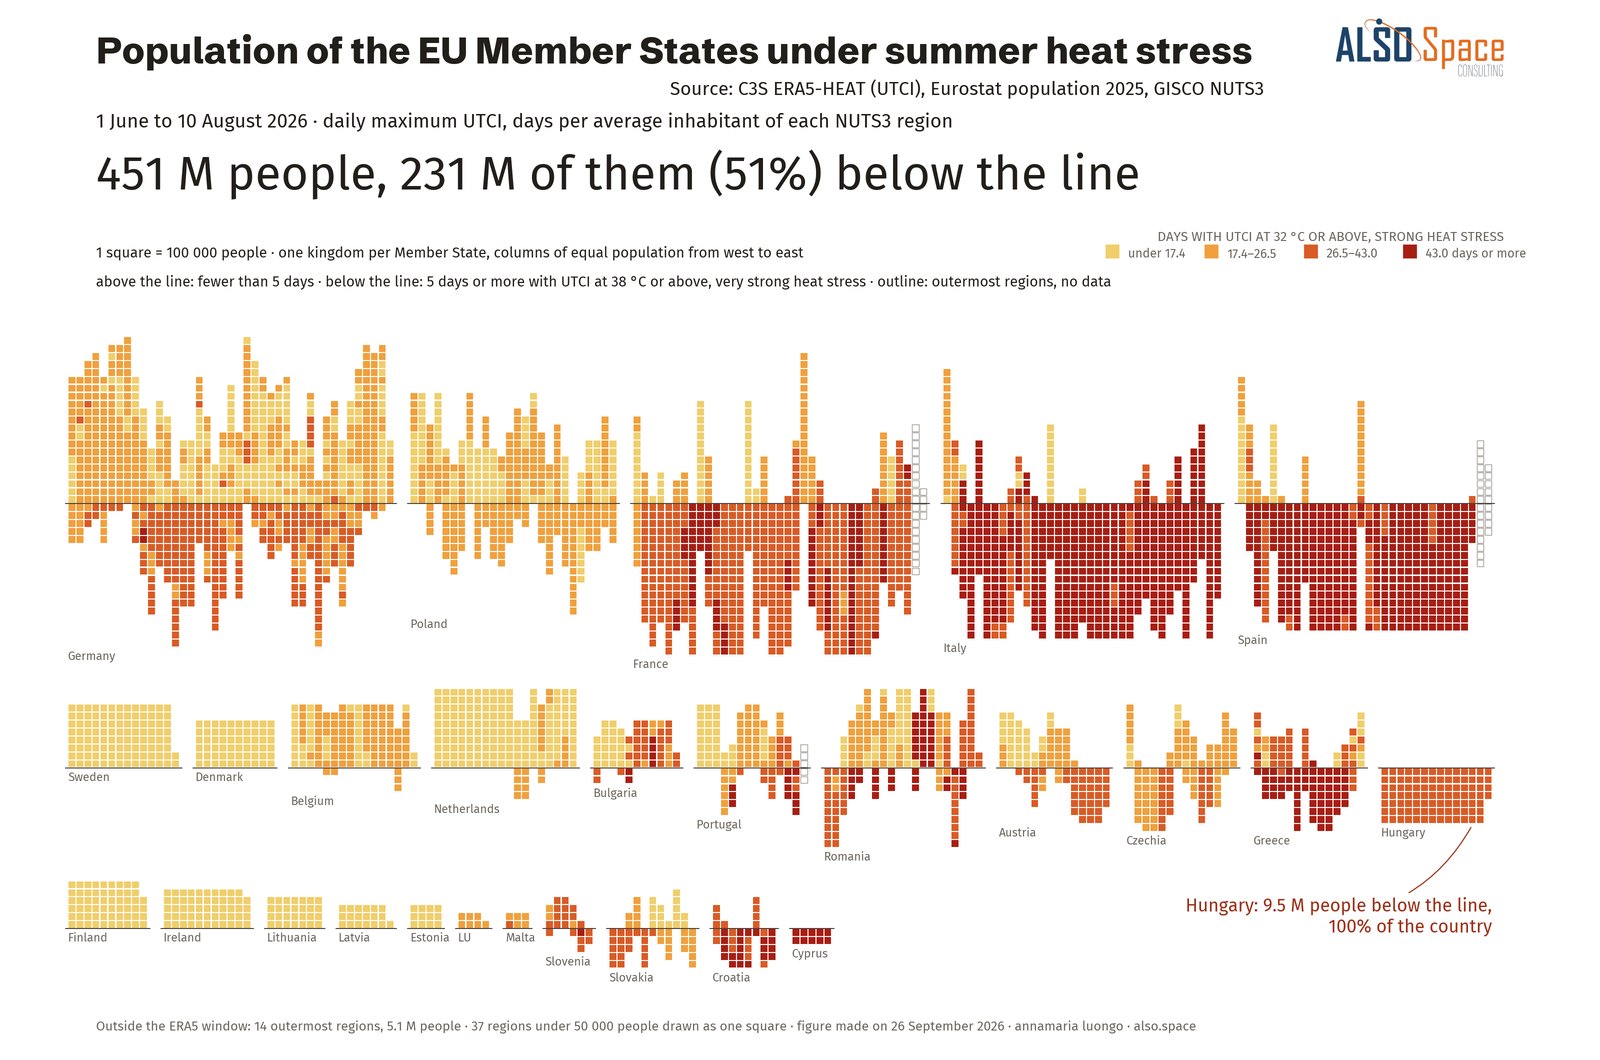
Population of the EU Member States under summer heat stress
13 · unit grids · ERA5-HEAT and population
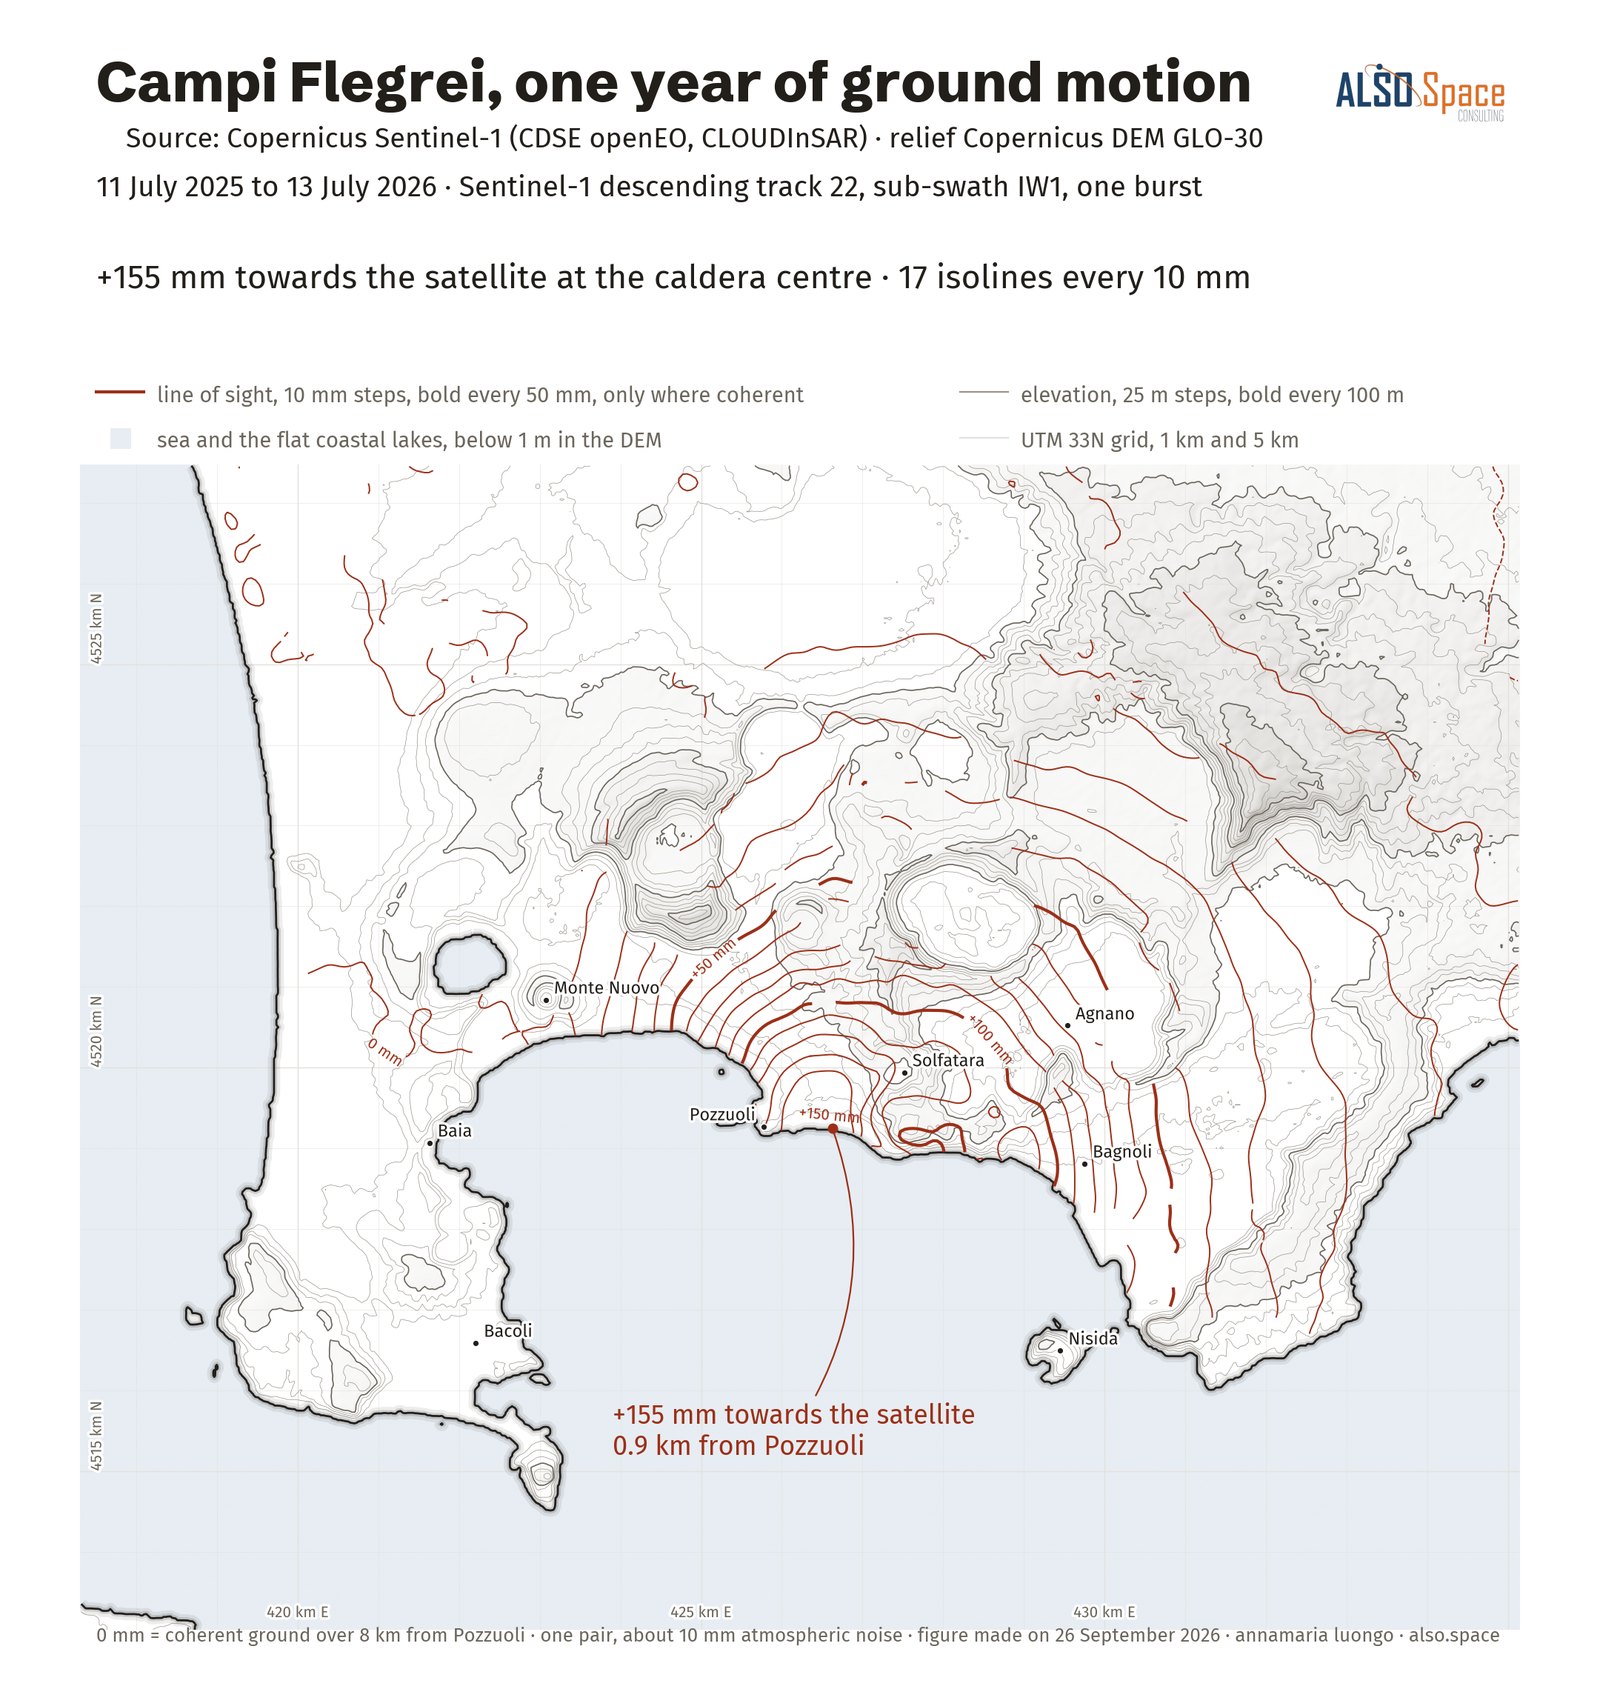
Campi Flegrei, one year of ground motion
14 · reference cartography · Sentinel-1 InSAR
Blog · Every European summer since 1940, one petal each · The rarest heat peaks of summer 2026 were in central Europe and France · On 27 June 2026, 383 million people in the EU were under strong heat stress · In summer 2026, fire followed the heat, not the drought · Blog · Every European summer since 1940, one petal each · The rarest heat peaks of summer 2026 were in central Europe and France · On 27 June 2026, 383 million people in the EU were under strong heat stress · In summer 2026, fire followed the heat, not the drought
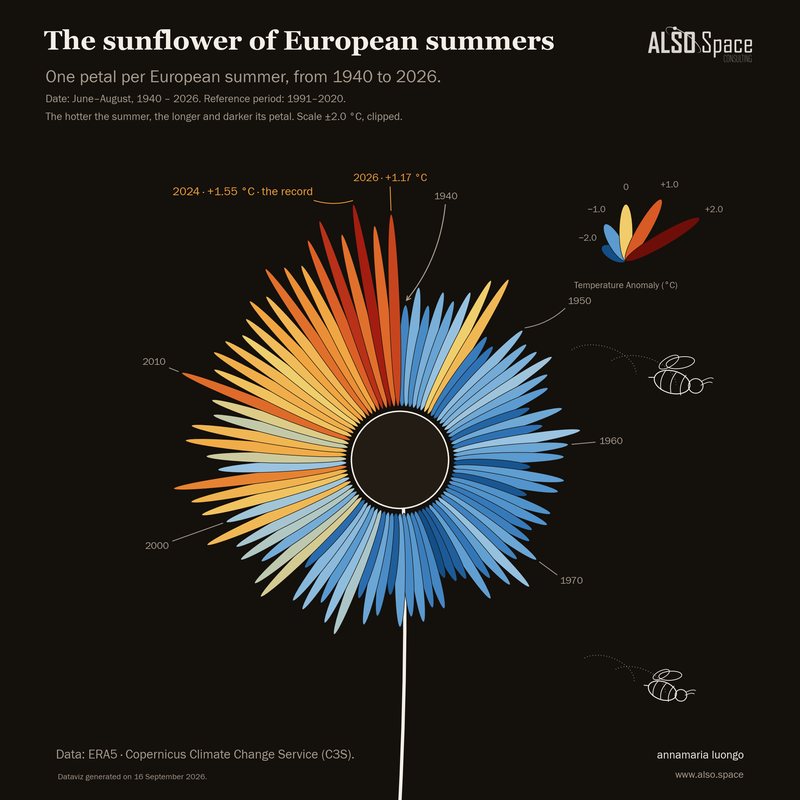
The sunflower of European summers: one petal for each summer from 1940 to 2026, longer and darker when the summer was warmer than the 1991–2020 average
Every European summer since 1940, one petal each

Nine of the ten warmest European summers on record came in 2010 or later. The summer of 2026 was the third warmest, and nearly half of its heat came in June.

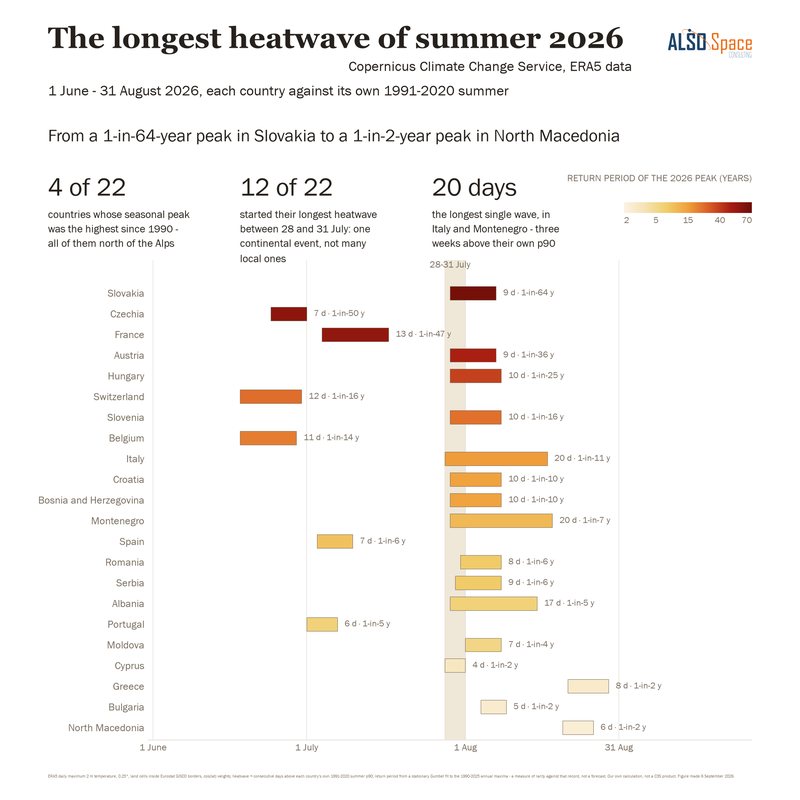
The longest heatwave of summer 2026 in 22 European countries, one bar per country along the summer, coloured by the return period of its peak
The rarest heat peaks of summer 2026 were in central Europe and France

Slovakia, Czechia, France, and Austria set their highest summer peak since 1990. Further south, the heat lasted longer, and between 28 and 31 July, 12 of the 22 countries entered their longest heatwave.

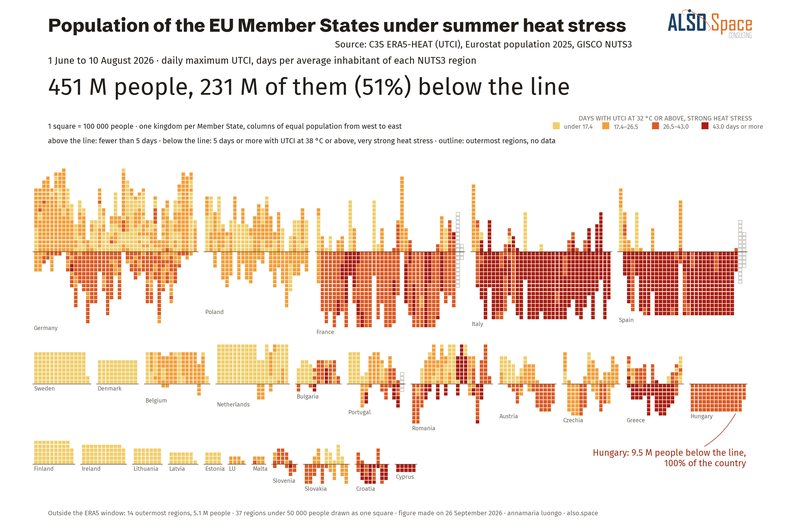
Population of the EU Member States under summer heat stress, 1 June to 10 August 2026: one square for every 100,000 people, below the line those living in regions which averaged five days or more of very strong heat stress
On 27 June 2026, 383 million people in the EU were under strong heat stress

Counted in people, the summer of 2026 affected almost every resident of the European Union, and it was most unusual where heat is least familiar.

Get in touch
Annamaria Luongo · Earth Observation scientist · Managing Partner, ALSO Space · Brussels · Salerno
info@annamarialuongo.com · LinkedIn · X · Instagram
Images contain modified Copernicus data 2016–2026, processed by Annamaria Luongo, ALSO Space.
Privacy · No cookies